| __timestamp | AMETEK, Inc. | United Rentals, Inc. |
|---|---|---|
| Wednesday, January 1, 2014 | 462637000 | 758000000 |
| Thursday, January 1, 2015 | 448592000 | 714000000 |
| Friday, January 1, 2016 | 462970000 | 719000000 |
| Sunday, January 1, 2017 | 533645000 | 903000000 |
| Monday, January 1, 2018 | 584022000 | 1038000000 |
| Tuesday, January 1, 2019 | 610280000 | 1092000000 |
| Wednesday, January 1, 2020 | 515630000 | 979000000 |
| Friday, January 1, 2021 | 603944000 | 1199000000 |
| Saturday, January 1, 2022 | 644577000 | 1400000000 |
| Sunday, January 1, 2023 | 677006000 | 1527000000 |
| Monday, January 1, 2024 | 696905000 | 1645000000 |
Unlocking the unknown
In the ever-evolving landscape of corporate finance, understanding the trends in Selling, General, and Administrative (SG&A) expenses is crucial for investors and analysts alike. Over the past decade, United Rentals, Inc. and AMETEK, Inc. have showcased distinct trajectories in their SG&A expenditures. From 2014 to 2023, United Rentals saw a significant increase of approximately 101% in their SG&A expenses, reflecting their aggressive expansion and operational scaling. In contrast, AMETEK's SG&A expenses grew by about 46%, indicating a more measured approach to growth. Notably, United Rentals' expenses surged past AMETEK's by nearly 2.3 times in 2023, highlighting their dominant market strategy. However, data for 2024 is incomplete, leaving room for speculation on future trends. This comparative analysis offers a window into the strategic priorities of these industry giants, providing valuable insights for stakeholders.
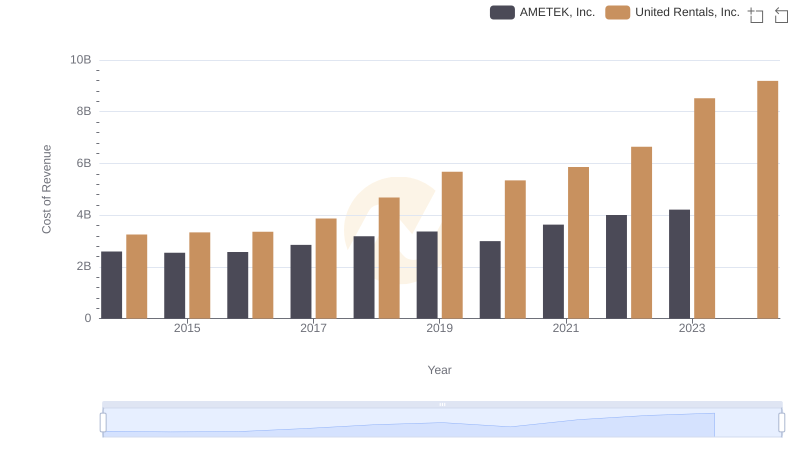
Comparing Cost of Revenue Efficiency: United Rentals, Inc. vs AMETEK, Inc.
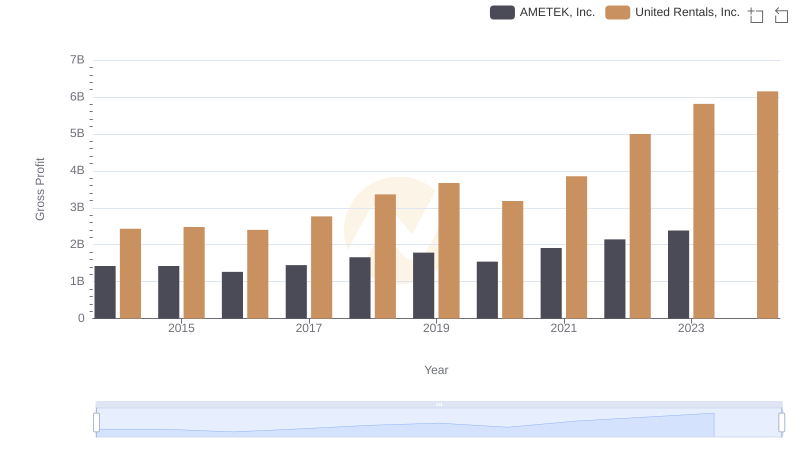
Gross Profit Analysis: Comparing United Rentals, Inc. and AMETEK, Inc.
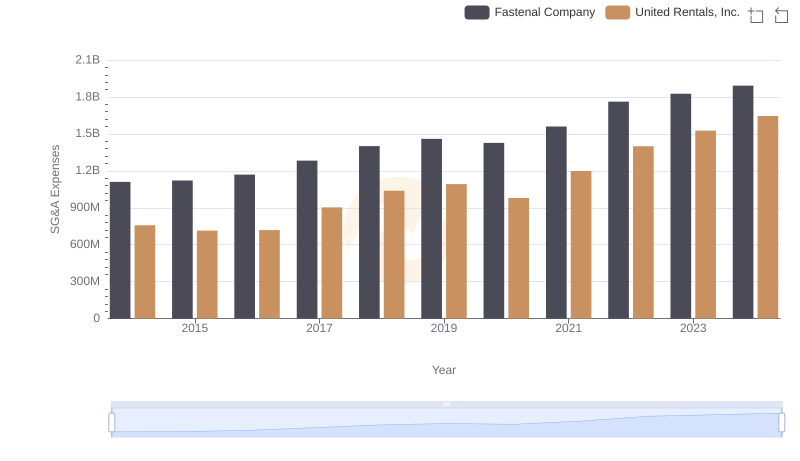
Selling, General, and Administrative Costs: United Rentals, Inc. vs Fastenal Company
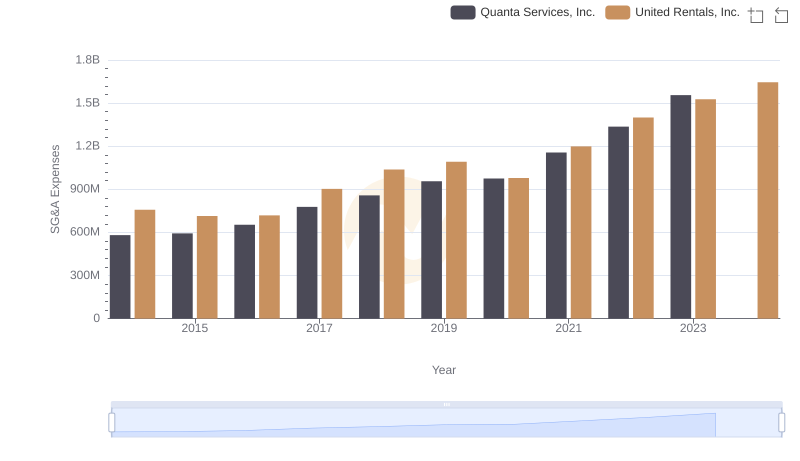
United Rentals, Inc. and Quanta Services, Inc.: SG&A Spending Patterns Compared
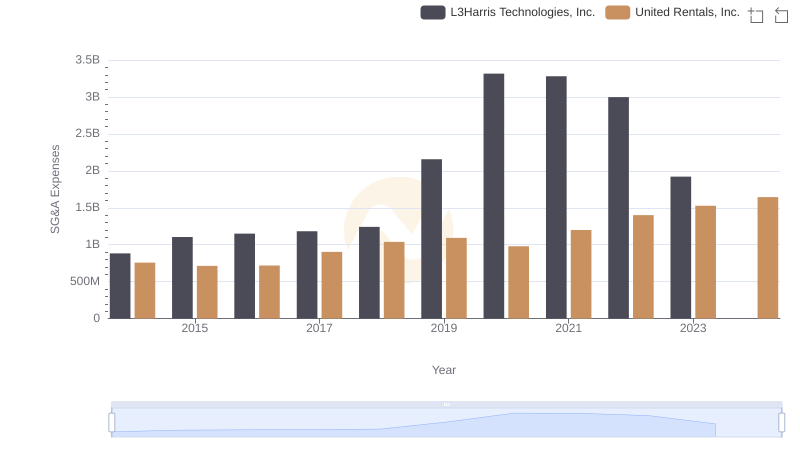
United Rentals, Inc. vs L3Harris Technologies, Inc.: SG&A Expense Trends
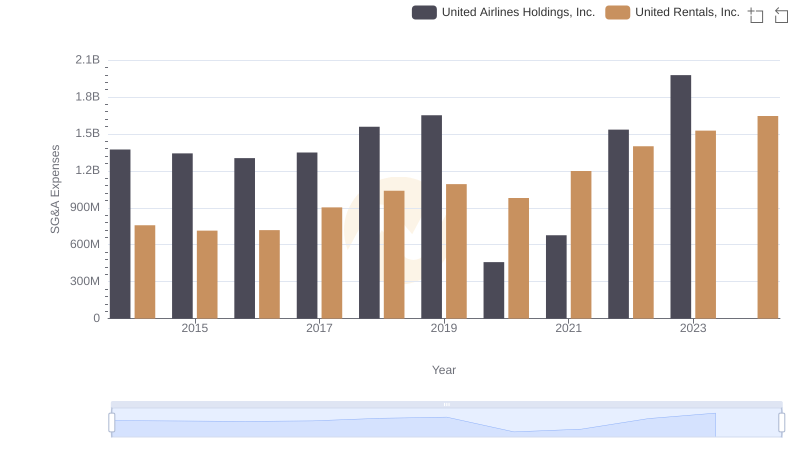
SG&A Efficiency Analysis: Comparing United Rentals, Inc. and United Airlines Holdings, Inc.
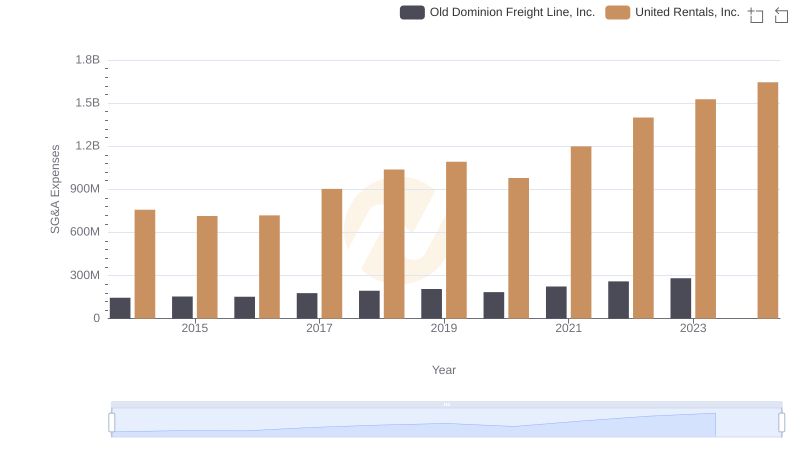
Cost Management Insights: SG&A Expenses for United Rentals, Inc. and Old Dominion Freight Line, Inc.
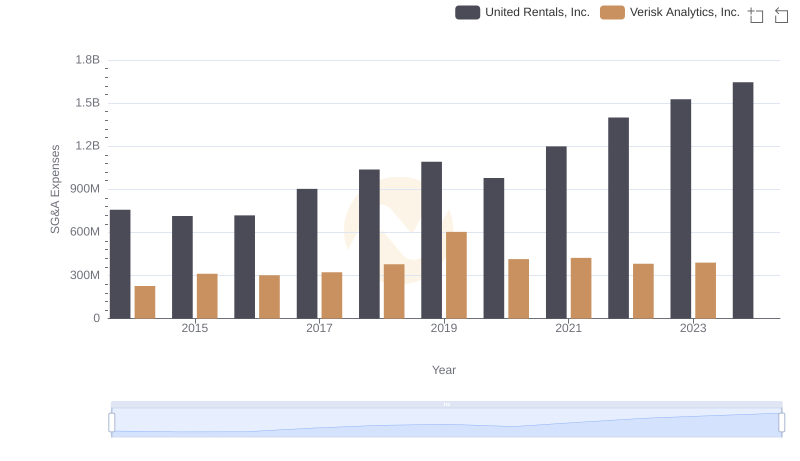
Operational Costs Compared: SG&A Analysis of United Rentals, Inc. and Verisk Analytics, Inc.
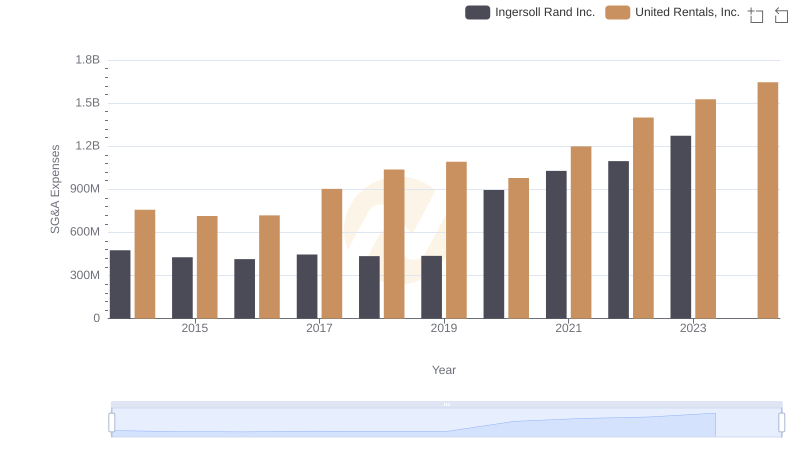
United Rentals, Inc. and Ingersoll Rand Inc.: SG&A Spending Patterns Compared
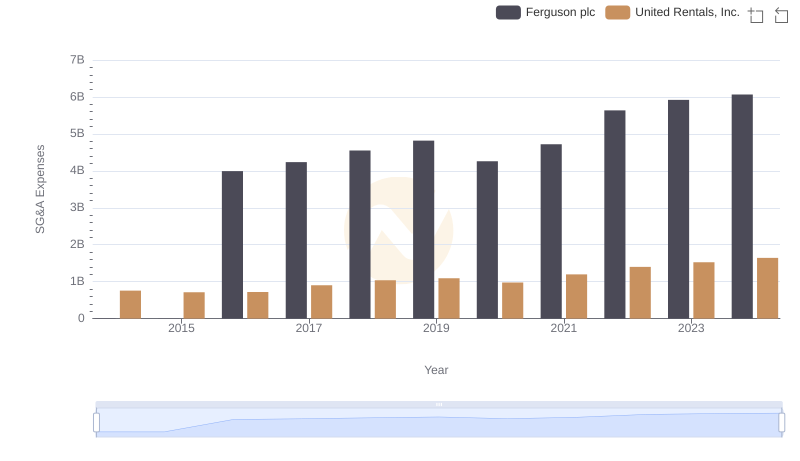
Comparing SG&A Expenses: United Rentals, Inc. vs Ferguson plc Trends and Insights
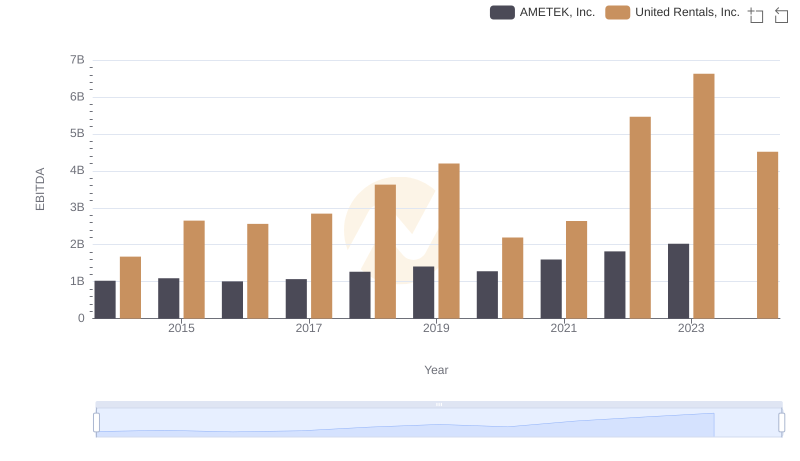
A Side-by-Side Analysis of EBITDA: United Rentals, Inc. and AMETEK, Inc.