| __timestamp | United Rentals, Inc. | Waste Connections, Inc. |
|---|---|---|
| Wednesday, January 1, 2014 | 758000000 | 229474000 |
| Thursday, January 1, 2015 | 714000000 | 237484000 |
| Friday, January 1, 2016 | 719000000 | 474263000 |
| Sunday, January 1, 2017 | 903000000 | 509638000 |
| Monday, January 1, 2018 | 1038000000 | 524388000 |
| Tuesday, January 1, 2019 | 1092000000 | 546278000 |
| Wednesday, January 1, 2020 | 979000000 | 537632000 |
| Friday, January 1, 2021 | 1199000000 | 612337000 |
| Saturday, January 1, 2022 | 1400000000 | 696467000 |
| Sunday, January 1, 2023 | 1527000000 | 799119000 |
| Monday, January 1, 2024 | 1645000000 | 883445000 |
Cracking the code
In the ever-evolving landscape of corporate finance, understanding the nuances of Selling, General, and Administrative (SG&A) expenses is crucial. Over the past decade, United Rentals, Inc. and Waste Connections, Inc. have showcased distinct trajectories in their SG&A expenditures. From 2014 to 2023, United Rentals, Inc. saw a staggering 117% increase in SG&A costs, peaking in 2023. In contrast, Waste Connections, Inc. experienced a more modest 248% rise, reflecting a steady growth pattern. Notably, 2024 data for Waste Connections, Inc. remains elusive, hinting at potential strategic shifts. This analysis underscores the importance of SG&A management in maintaining competitive advantage and financial health. As businesses navigate the complexities of the modern economy, these insights offer a window into the strategic priorities of industry leaders.

Comparing Revenue Performance: United Rentals, Inc. or Waste Connections, Inc.?
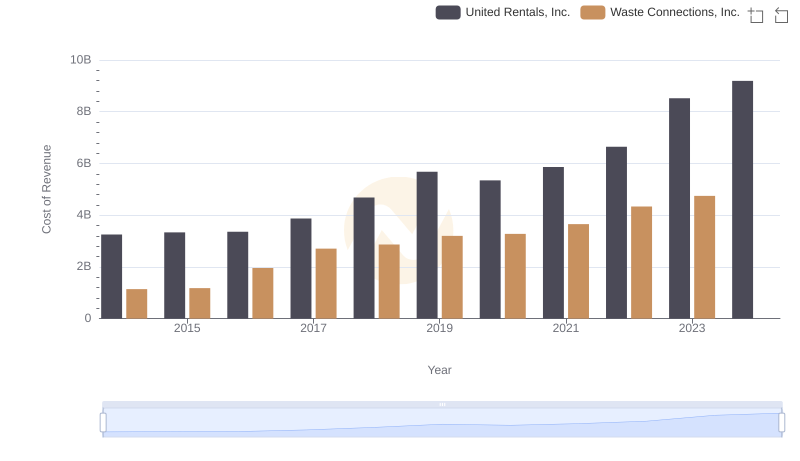
Analyzing Cost of Revenue: United Rentals, Inc. and Waste Connections, Inc.
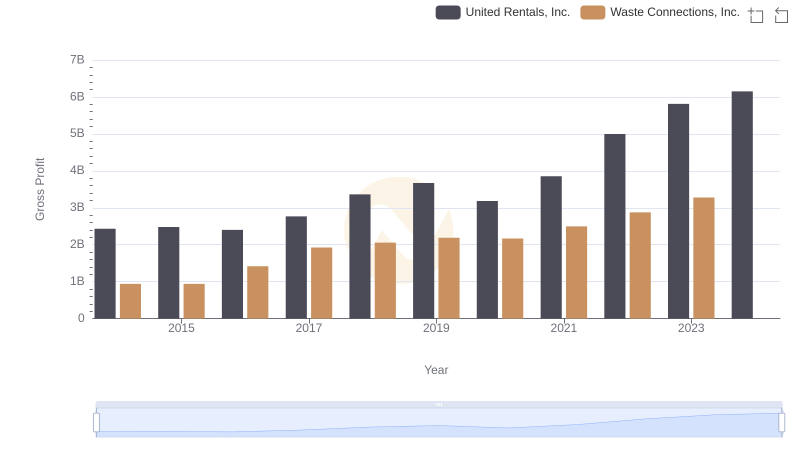
Gross Profit Trends Compared: United Rentals, Inc. vs Waste Connections, Inc.
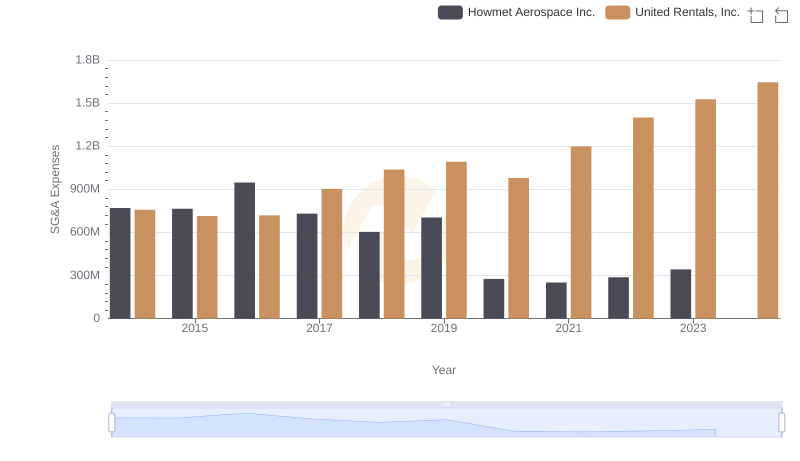
Operational Costs Compared: SG&A Analysis of United Rentals, Inc. and Howmet Aerospace Inc.
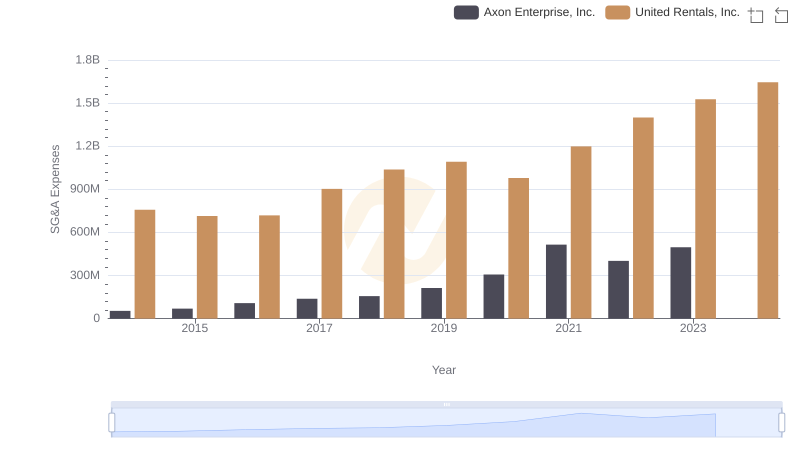
Comparing SG&A Expenses: United Rentals, Inc. vs Axon Enterprise, Inc. Trends and Insights
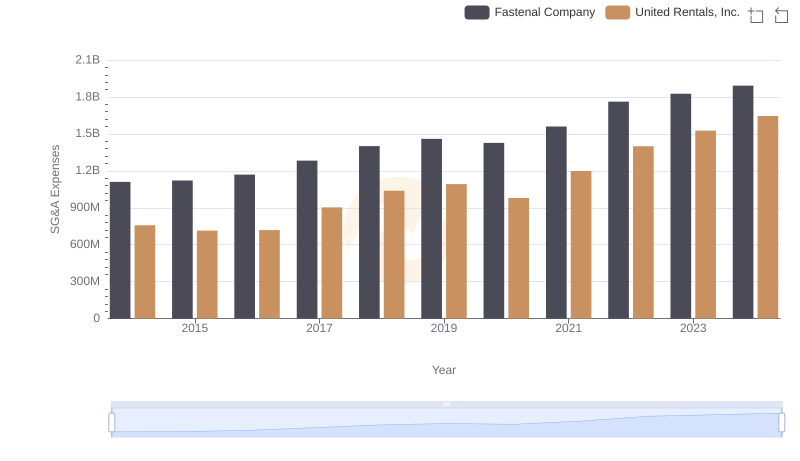
Selling, General, and Administrative Costs: United Rentals, Inc. vs Fastenal Company
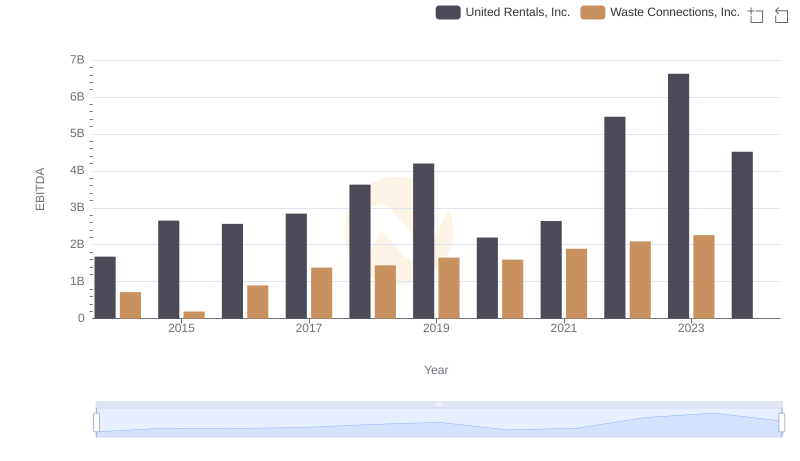
Comparative EBITDA Analysis: United Rentals, Inc. vs Waste Connections, Inc.
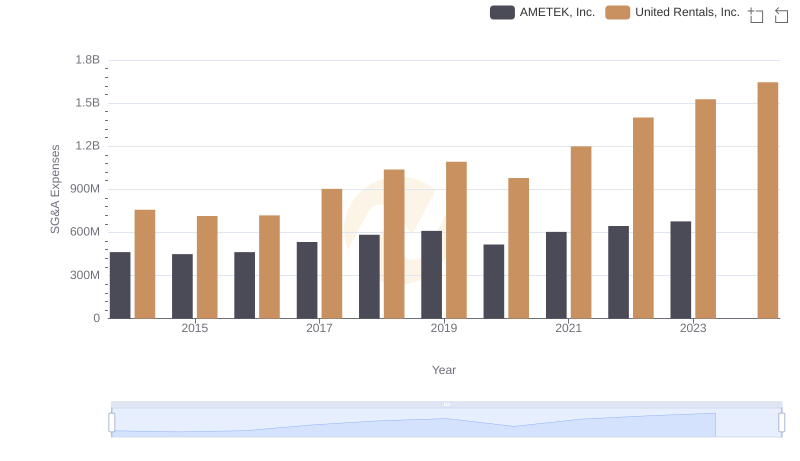
United Rentals, Inc. vs AMETEK, Inc.: SG&A Expense Trends
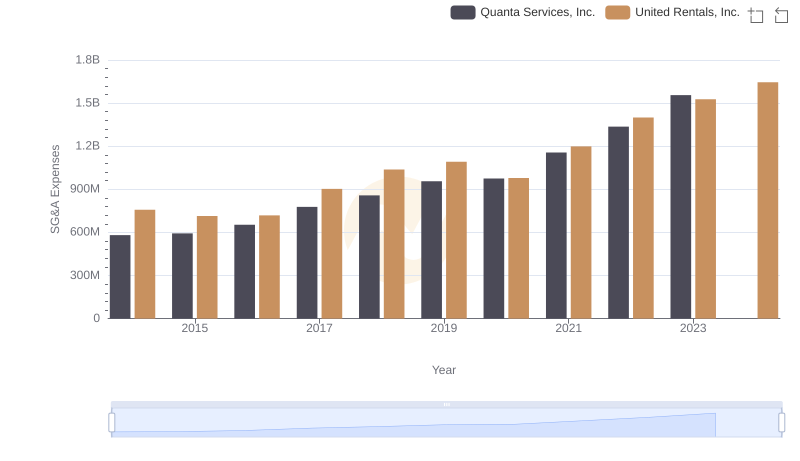
United Rentals, Inc. and Quanta Services, Inc.: SG&A Spending Patterns Compared
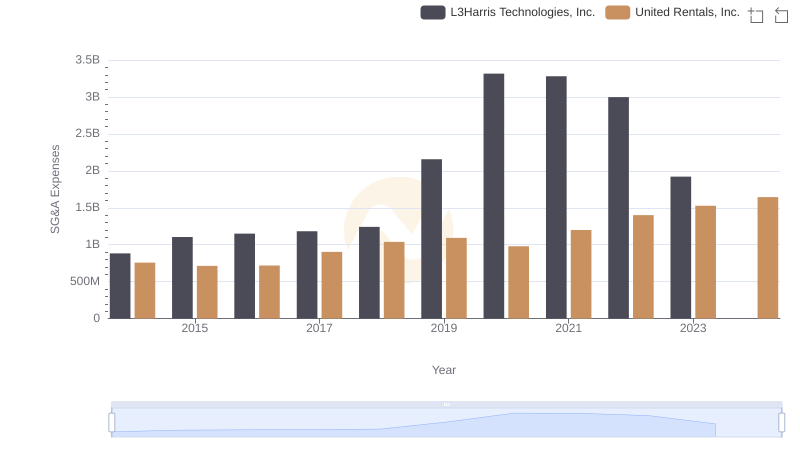
United Rentals, Inc. vs L3Harris Technologies, Inc.: SG&A Expense Trends
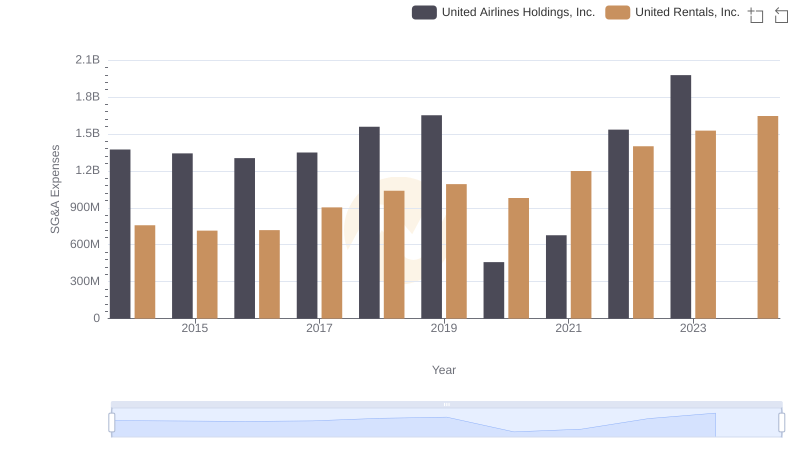
SG&A Efficiency Analysis: Comparing United Rentals, Inc. and United Airlines Holdings, Inc.