| __timestamp | Fastenal Company | United Rentals, Inc. |
|---|---|---|
| Wednesday, January 1, 2014 | 1836105000 | 3253000000 |
| Thursday, January 1, 2015 | 1920253000 | 3337000000 |
| Friday, January 1, 2016 | 1997259000 | 3359000000 |
| Sunday, January 1, 2017 | 2226900000 | 3872000000 |
| Monday, January 1, 2018 | 2566200000 | 4683000000 |
| Tuesday, January 1, 2019 | 2818300000 | 5681000000 |
| Wednesday, January 1, 2020 | 3079500000 | 5347000000 |
| Friday, January 1, 2021 | 3233700000 | 5863000000 |
| Saturday, January 1, 2022 | 3764800000 | 6646000000 |
| Sunday, January 1, 2023 | 3992200000 | 8519000000 |
| Monday, January 1, 2024 | 4144100000 | 9195000000 |
Unleashing insights
In the ever-evolving landscape of industrial services, understanding cost structures is pivotal. United Rentals, Inc. and Fastenal Company, two giants in their respective fields, offer a fascinating glimpse into cost management over the past decade. From 2014 to 2024, United Rentals has seen its cost of revenue soar by approximately 183%, reflecting its aggressive expansion and market penetration strategies. In contrast, Fastenal's cost of revenue increased by about 126%, showcasing a more measured growth approach.
United Rentals consistently outpaces Fastenal in cost of revenue, with 2024 figures showing United Rentals at nearly double Fastenal's. This trend underscores United Rentals' larger operational scale and broader service offerings. As we delve into these financial insights, it becomes clear that strategic cost management is crucial for maintaining competitive advantage in the industrial sector.
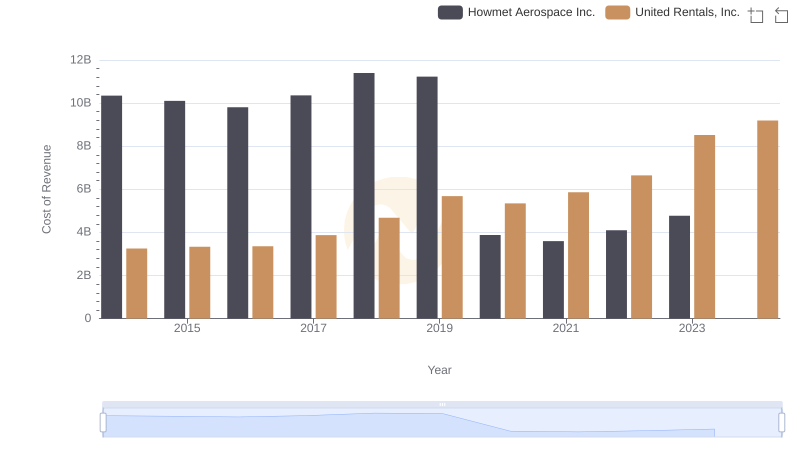
Analyzing Cost of Revenue: United Rentals, Inc. and Howmet Aerospace Inc.
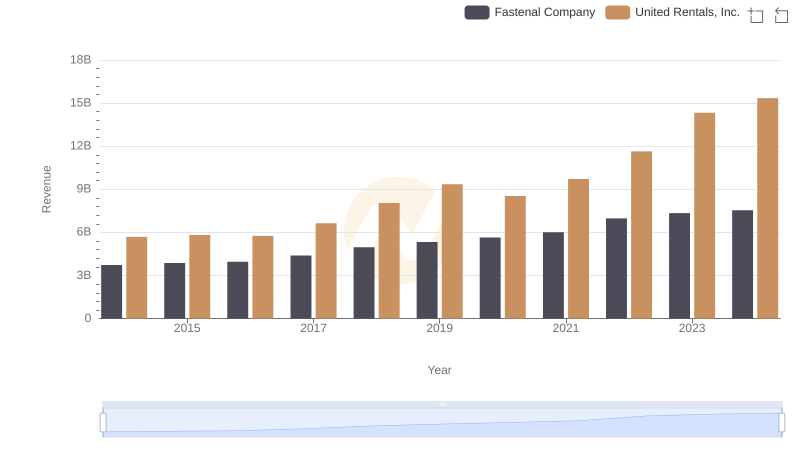
Revenue Showdown: United Rentals, Inc. vs Fastenal Company
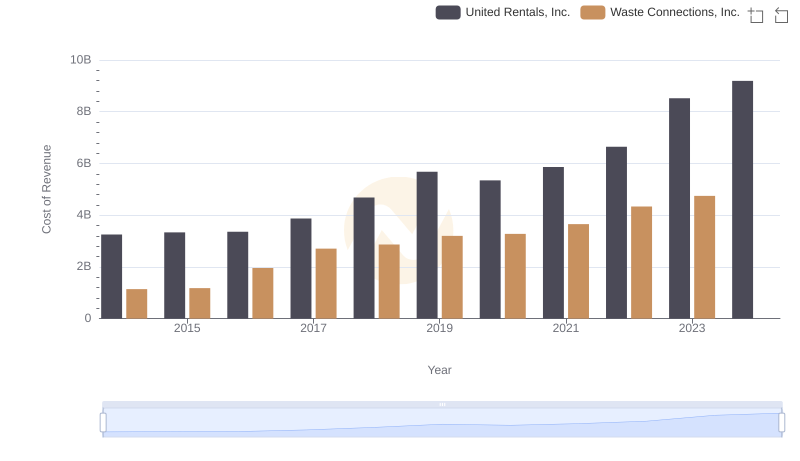
Analyzing Cost of Revenue: United Rentals, Inc. and Waste Connections, Inc.
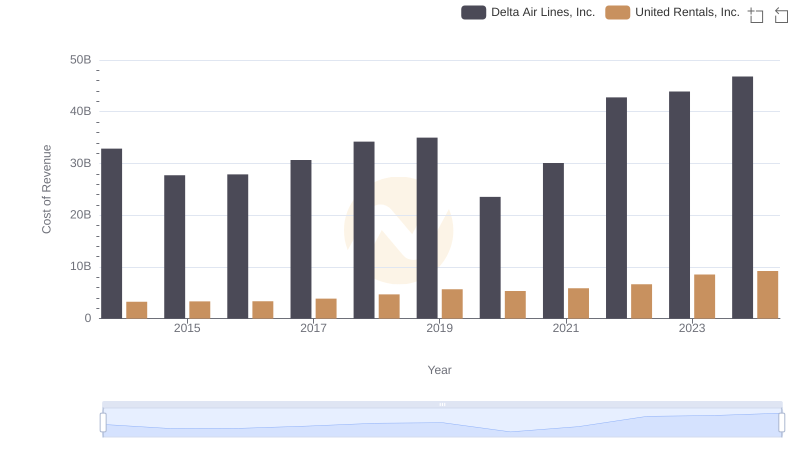
Cost Insights: Breaking Down United Rentals, Inc. and Delta Air Lines, Inc.'s Expenses
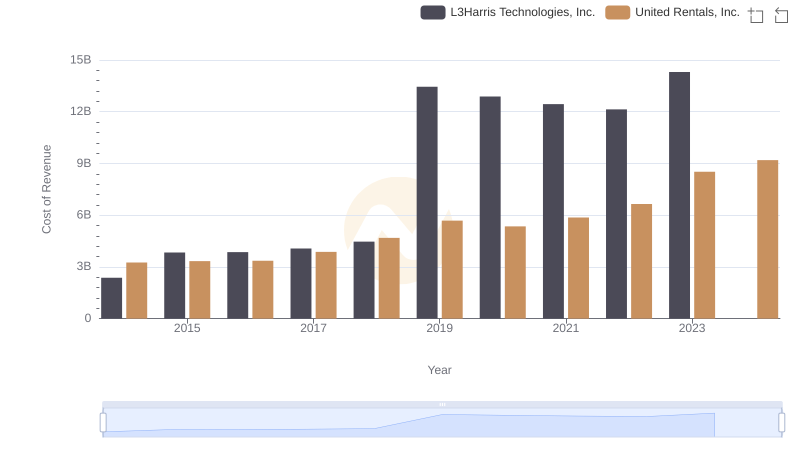
United Rentals, Inc. vs L3Harris Technologies, Inc.: Efficiency in Cost of Revenue Explored
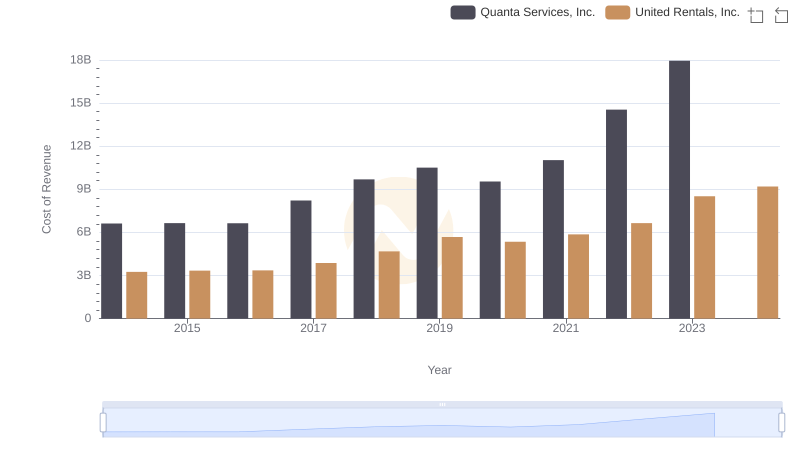
United Rentals, Inc. vs Quanta Services, Inc.: Efficiency in Cost of Revenue Explored
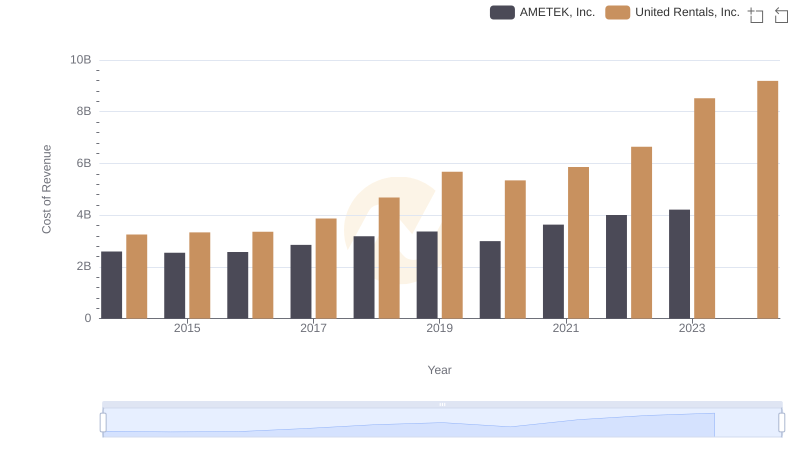
Comparing Cost of Revenue Efficiency: United Rentals, Inc. vs AMETEK, Inc.
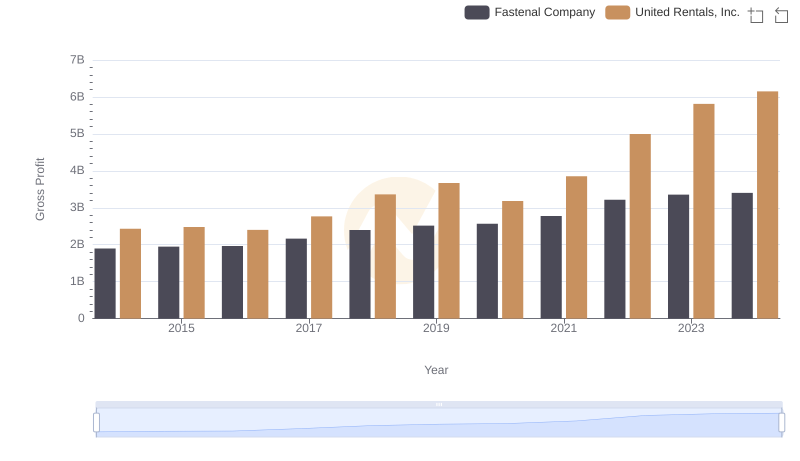
Gross Profit Comparison: United Rentals, Inc. and Fastenal Company Trends
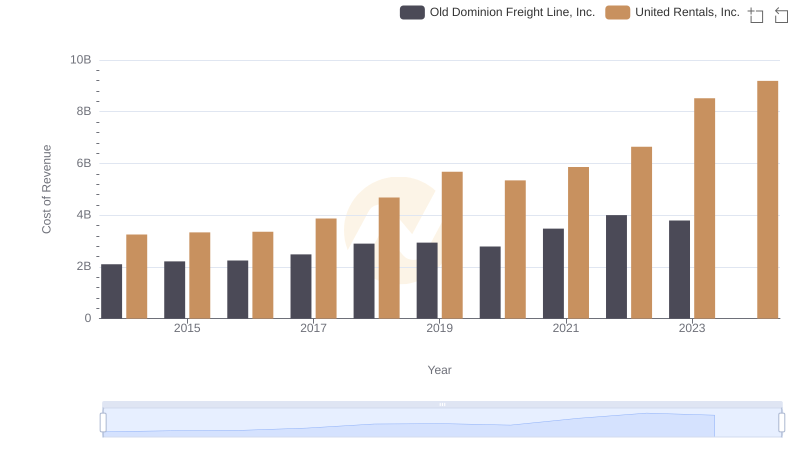
United Rentals, Inc. vs Old Dominion Freight Line, Inc.: Efficiency in Cost of Revenue Explored
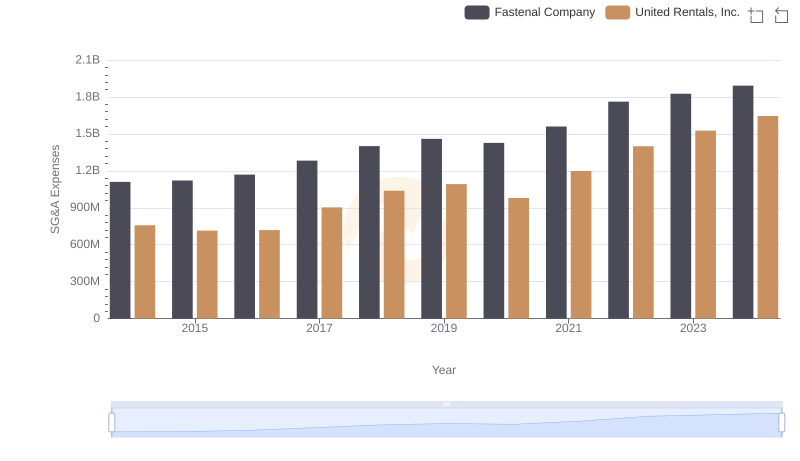
Selling, General, and Administrative Costs: United Rentals, Inc. vs Fastenal Company
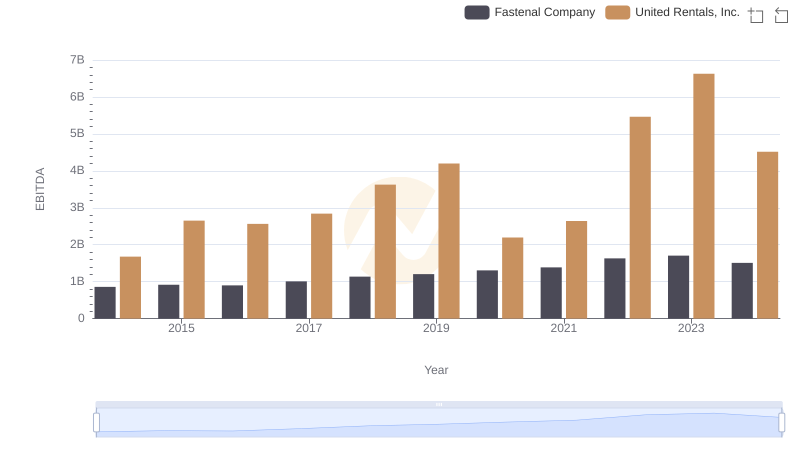
EBITDA Analysis: Evaluating United Rentals, Inc. Against Fastenal Company