| __timestamp | Howmet Aerospace Inc. | United Rentals, Inc. |
|---|---|---|
| Wednesday, January 1, 2014 | 770000000 | 758000000 |
| Thursday, January 1, 2015 | 765000000 | 714000000 |
| Friday, January 1, 2016 | 947000000 | 719000000 |
| Sunday, January 1, 2017 | 731000000 | 903000000 |
| Monday, January 1, 2018 | 604000000 | 1038000000 |
| Tuesday, January 1, 2019 | 704000000 | 1092000000 |
| Wednesday, January 1, 2020 | 277000000 | 979000000 |
| Friday, January 1, 2021 | 251000000 | 1199000000 |
| Saturday, January 1, 2022 | 288000000 | 1400000000 |
| Sunday, January 1, 2023 | 343000000 | 1527000000 |
| Monday, January 1, 2024 | 362000000 | 1645000000 |
Cracking the code
In the ever-evolving landscape of corporate America, operational efficiency is paramount. Over the past decade, United Rentals, Inc. and Howmet Aerospace Inc. have showcased contrasting trends in their Selling, General, and Administrative (SG&A) expenses. From 2014 to 2023, United Rentals has seen a steady increase in SG&A expenses, peaking at approximately 1.53 billion in 2023, a 102% rise from 2014. In contrast, Howmet Aerospace experienced a significant decline, with expenses dropping by 67% from 2014 to 2023. This divergence highlights United Rentals' aggressive expansion strategy, while Howmet Aerospace's cost-cutting measures reflect a focus on lean operations. Notably, 2020 marked a pivotal year for Howmet, with expenses plummeting to 277 million, possibly due to restructuring efforts. As we look to 2024, United Rentals continues its upward trajectory, while Howmet's data remains elusive, leaving room for speculation.

United Rentals, Inc. and Howmet Aerospace Inc.: A Comprehensive Revenue Analysis
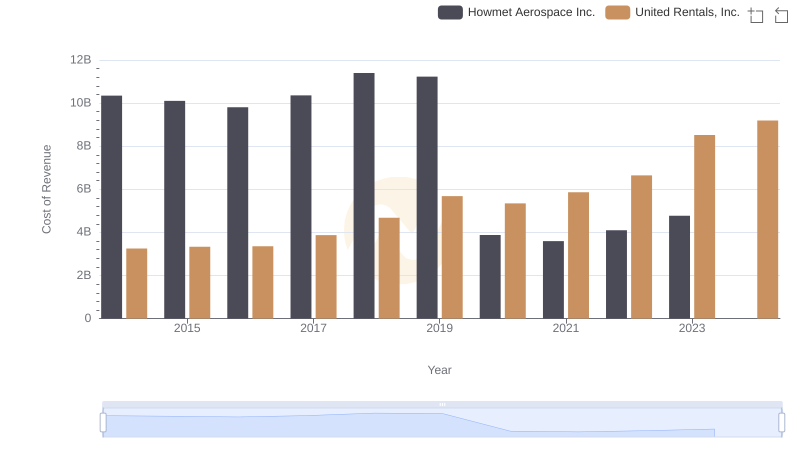
Analyzing Cost of Revenue: United Rentals, Inc. and Howmet Aerospace Inc.
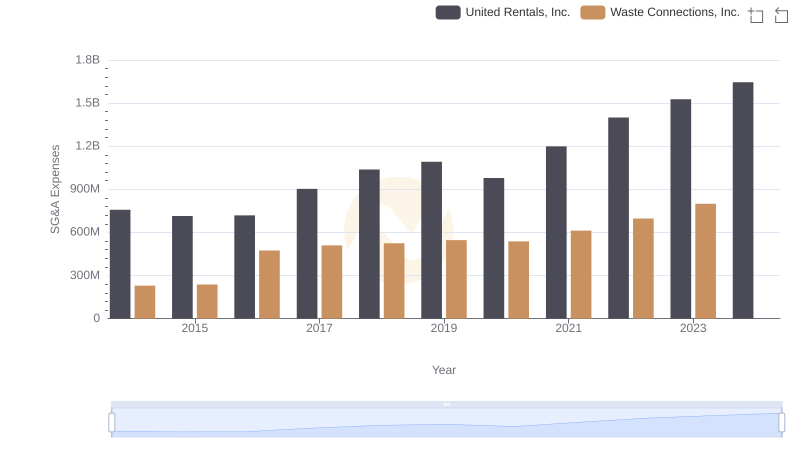
Selling, General, and Administrative Costs: United Rentals, Inc. vs Waste Connections, Inc.
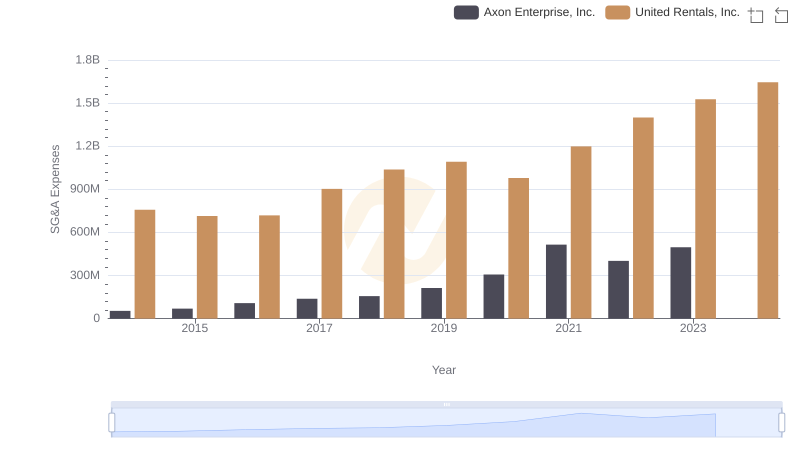
Comparing SG&A Expenses: United Rentals, Inc. vs Axon Enterprise, Inc. Trends and Insights
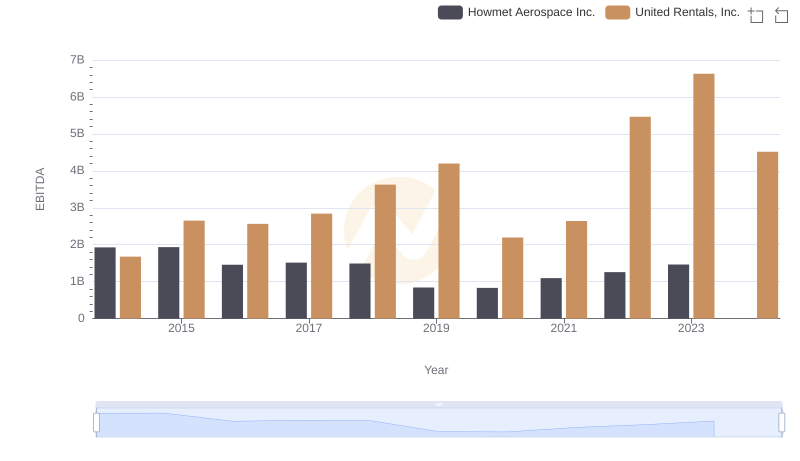
A Side-by-Side Analysis of EBITDA: United Rentals, Inc. and Howmet Aerospace Inc.
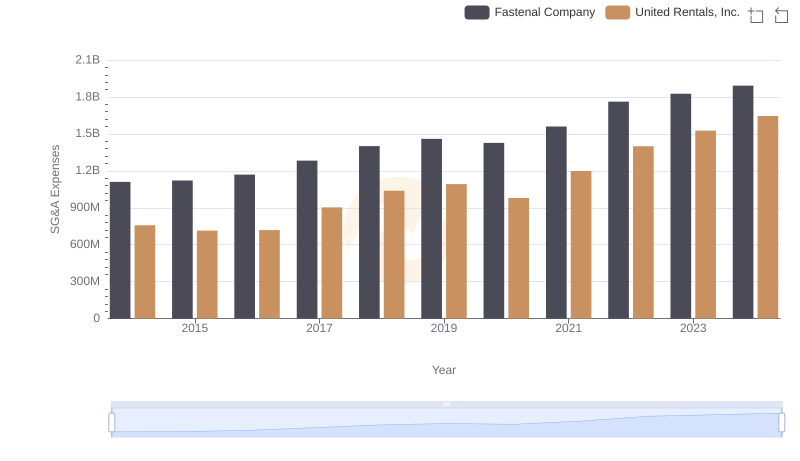
Selling, General, and Administrative Costs: United Rentals, Inc. vs Fastenal Company
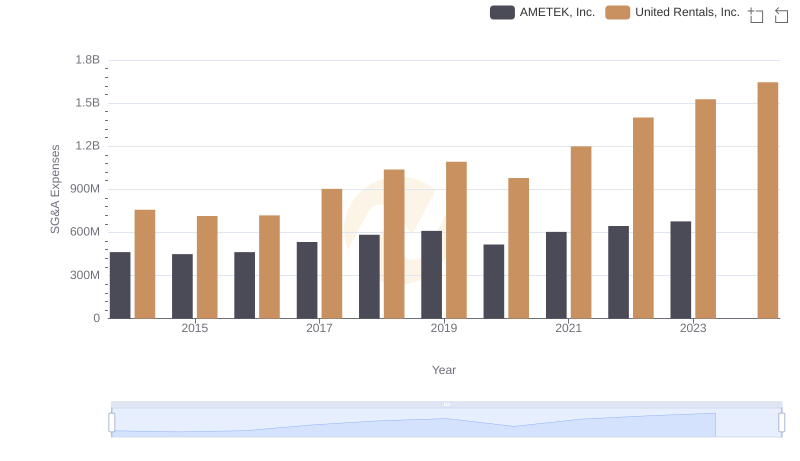
United Rentals, Inc. vs AMETEK, Inc.: SG&A Expense Trends
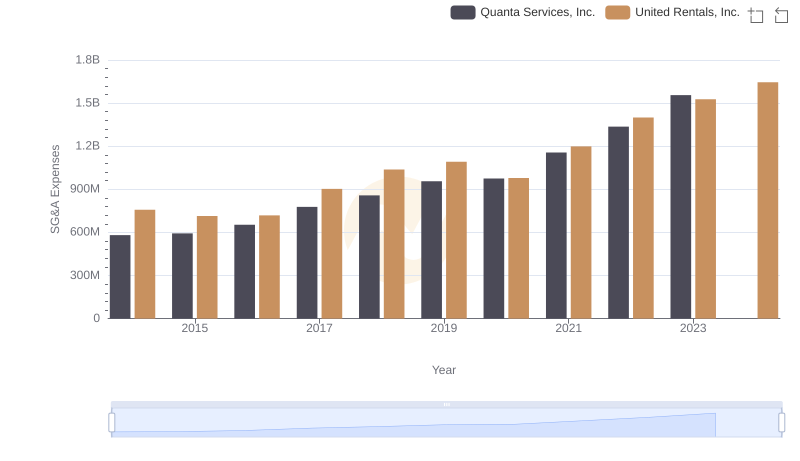
United Rentals, Inc. and Quanta Services, Inc.: SG&A Spending Patterns Compared
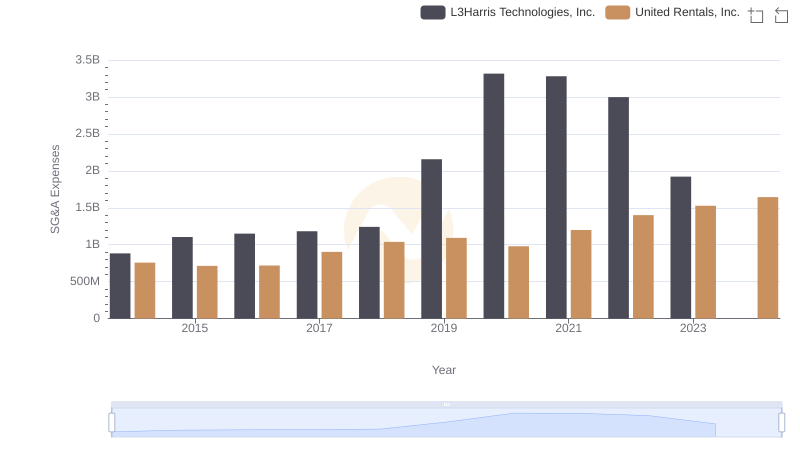
United Rentals, Inc. vs L3Harris Technologies, Inc.: SG&A Expense Trends
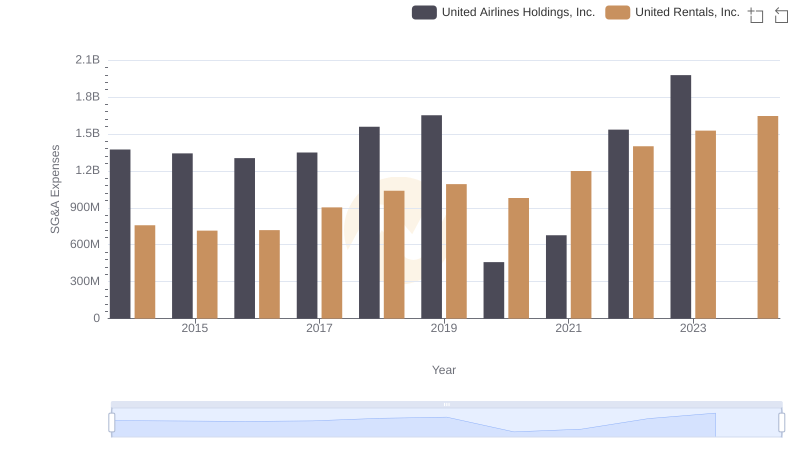
SG&A Efficiency Analysis: Comparing United Rentals, Inc. and United Airlines Holdings, Inc.