| __timestamp | L3Harris Technologies, Inc. | United Rentals, Inc. |
|---|---|---|
| Wednesday, January 1, 2014 | 883000000 | 758000000 |
| Thursday, January 1, 2015 | 1105000000 | 714000000 |
| Friday, January 1, 2016 | 1150000000 | 719000000 |
| Sunday, January 1, 2017 | 1182000000 | 903000000 |
| Monday, January 1, 2018 | 1242000000 | 1038000000 |
| Tuesday, January 1, 2019 | 2156000000 | 1092000000 |
| Wednesday, January 1, 2020 | 3315000000 | 979000000 |
| Friday, January 1, 2021 | 3280000000 | 1199000000 |
| Saturday, January 1, 2022 | 2998000000 | 1400000000 |
| Sunday, January 1, 2023 | 1921000000 | 1527000000 |
| Monday, January 1, 2024 | 3568000000 | 1645000000 |
Igniting the spark of knowledge
In the ever-evolving landscape of corporate finance, understanding the trends in Selling, General, and Administrative (SG&A) expenses is crucial for investors and analysts alike. Over the past decade, L3Harris Technologies, Inc. and United Rentals, Inc. have showcased distinct trajectories in their SG&A expenditures.
From 2014 to 2023, L3Harris Technologies experienced a significant rise in SG&A expenses, peaking in 2020 with a staggering 275% increase from 2014 levels. However, by 2023, these expenses had decreased by approximately 42% from their peak. In contrast, United Rentals, Inc. demonstrated a more consistent growth pattern, with SG&A expenses increasing by about 115% over the same period, reaching their highest in 2024.
These trends reflect strategic shifts and market dynamics, offering valuable insights into each company's operational focus and financial health.
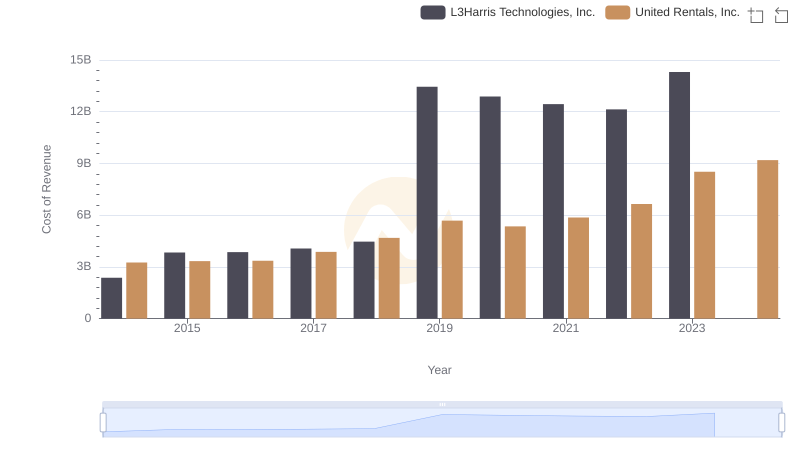
United Rentals, Inc. vs L3Harris Technologies, Inc.: Efficiency in Cost of Revenue Explored
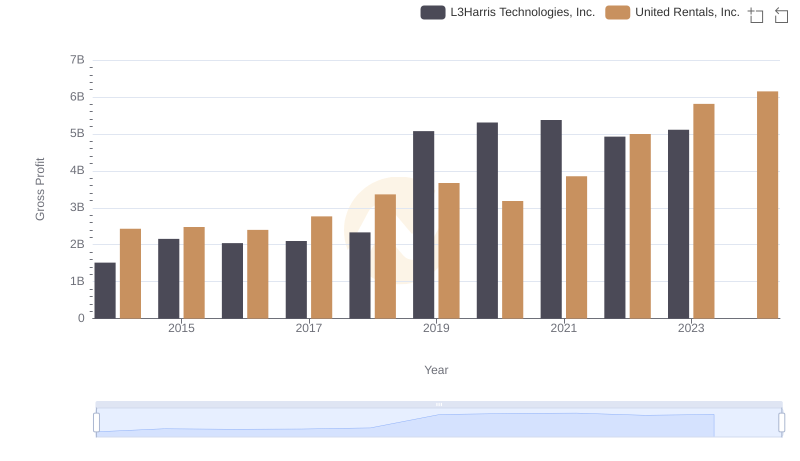
United Rentals, Inc. vs L3Harris Technologies, Inc.: A Gross Profit Performance Breakdown
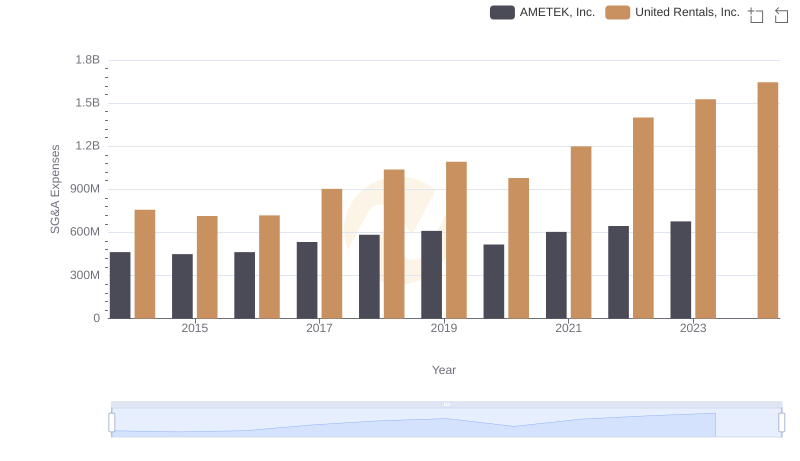
United Rentals, Inc. vs AMETEK, Inc.: SG&A Expense Trends
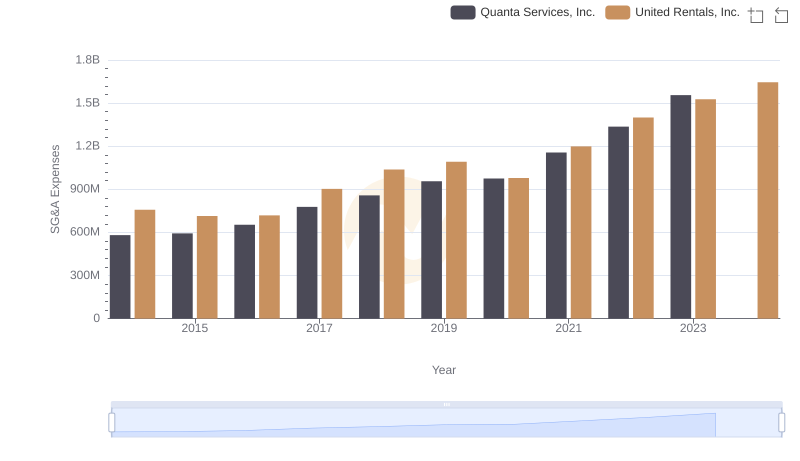
United Rentals, Inc. and Quanta Services, Inc.: SG&A Spending Patterns Compared
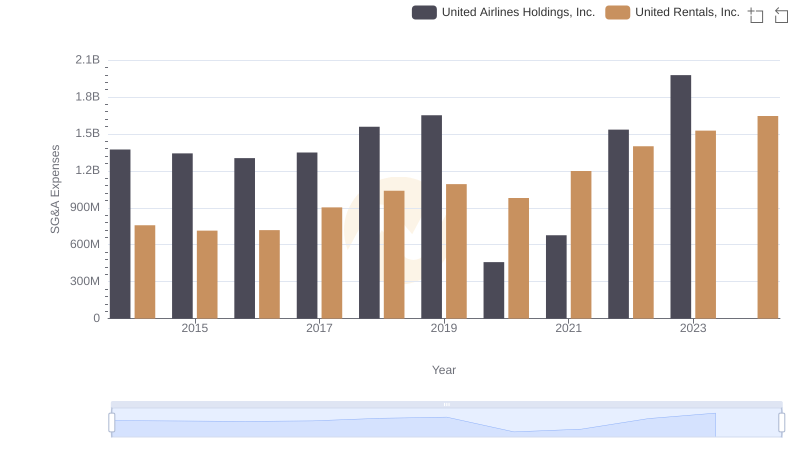
SG&A Efficiency Analysis: Comparing United Rentals, Inc. and United Airlines Holdings, Inc.
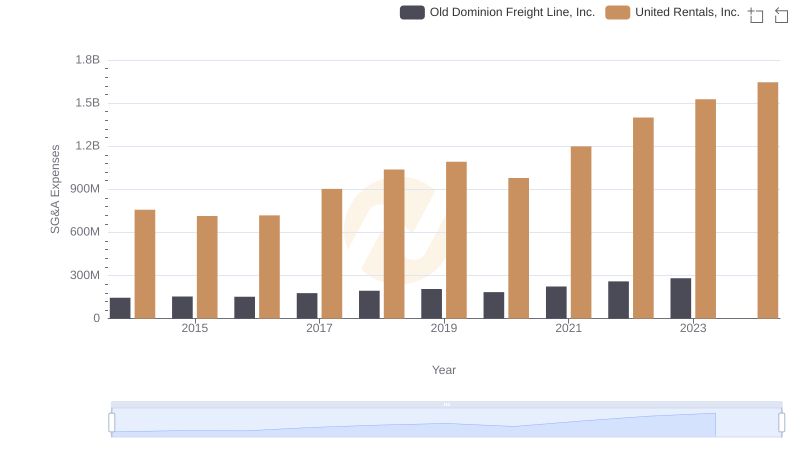
Cost Management Insights: SG&A Expenses for United Rentals, Inc. and Old Dominion Freight Line, Inc.
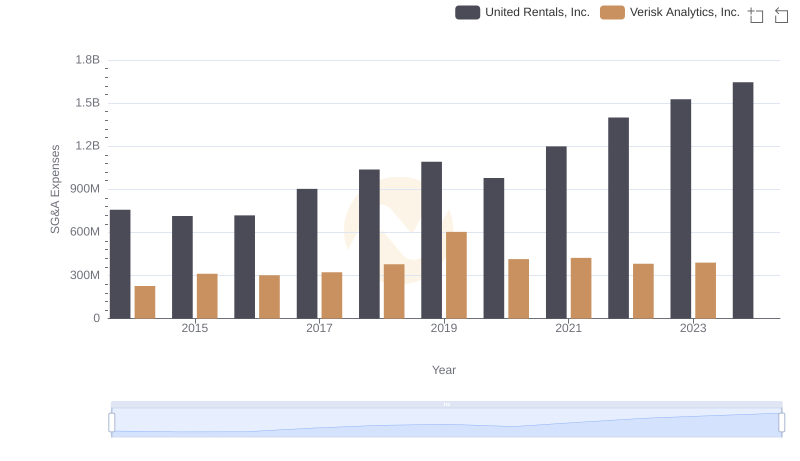
Operational Costs Compared: SG&A Analysis of United Rentals, Inc. and Verisk Analytics, Inc.
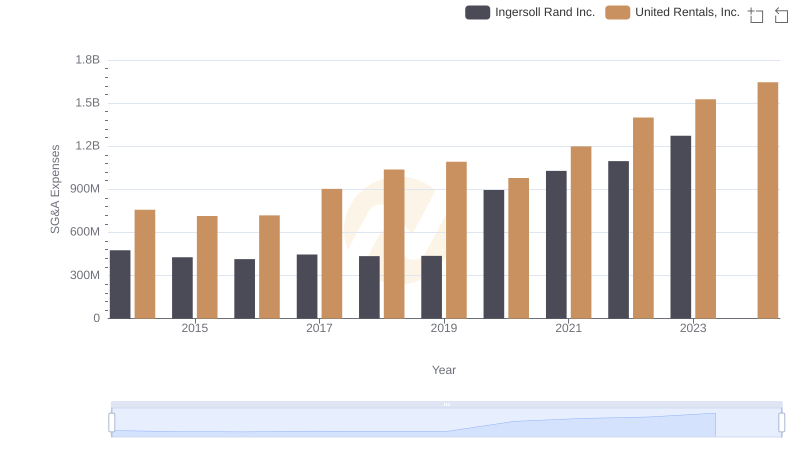
United Rentals, Inc. and Ingersoll Rand Inc.: SG&A Spending Patterns Compared
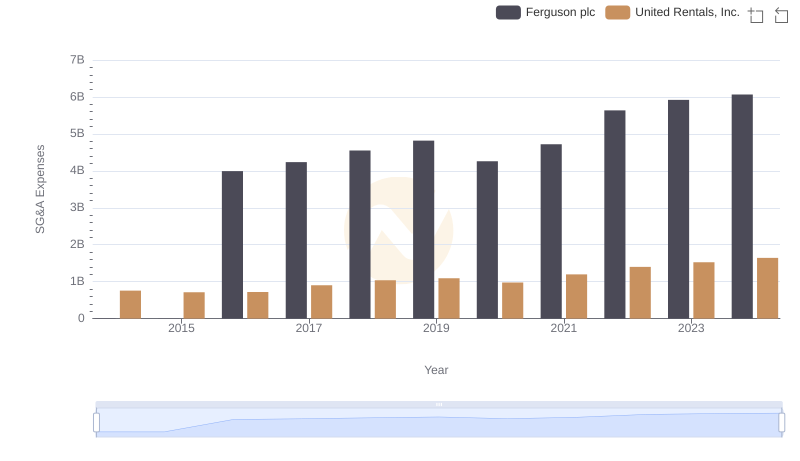
Comparing SG&A Expenses: United Rentals, Inc. vs Ferguson plc Trends and Insights
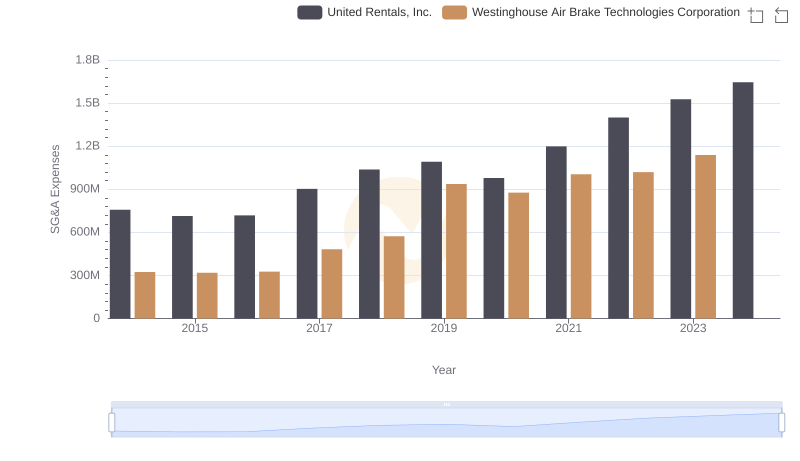
Cost Management Insights: SG&A Expenses for United Rentals, Inc. and Westinghouse Air Brake Technologies Corporation
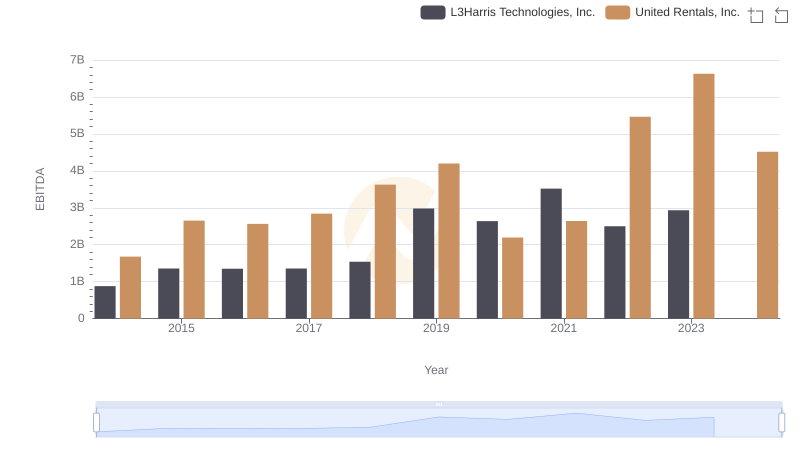
A Professional Review of EBITDA: United Rentals, Inc. Compared to L3Harris Technologies, Inc.