| __timestamp | United Airlines Holdings, Inc. | United Rentals, Inc. |
|---|---|---|
| Wednesday, January 1, 2014 | 1373000000 | 758000000 |
| Thursday, January 1, 2015 | 1342000000 | 714000000 |
| Friday, January 1, 2016 | 1303000000 | 719000000 |
| Sunday, January 1, 2017 | 1349000000 | 903000000 |
| Monday, January 1, 2018 | 1558000000 | 1038000000 |
| Tuesday, January 1, 2019 | 1651000000 | 1092000000 |
| Wednesday, January 1, 2020 | 459000000 | 979000000 |
| Friday, January 1, 2021 | 677000000 | 1199000000 |
| Saturday, January 1, 2022 | 1535000000 | 1400000000 |
| Sunday, January 1, 2023 | 1977000000 | 1527000000 |
| Monday, January 1, 2024 | 2231000000 | 1645000000 |
Data in motion
In the dynamic world of corporate finance, understanding the efficiency of Selling, General, and Administrative (SG&A) expenses is crucial. United Rentals, Inc. and United Airlines Holdings, Inc. offer a fascinating comparison over the past decade. From 2014 to 2023, United Airlines saw a significant fluctuation in SG&A expenses, with a notable dip in 2020, likely due to the pandemic's impact, before rebounding to a peak in 2023. In contrast, United Rentals displayed a steady upward trend, culminating in a 116% increase by 2024. This divergence highlights the resilience and strategic management of these companies in navigating economic challenges. The absence of data for United Airlines in 2024 suggests a potential gap in reporting or operational shifts. Such insights are invaluable for investors and analysts seeking to understand corporate efficiency and adaptability.
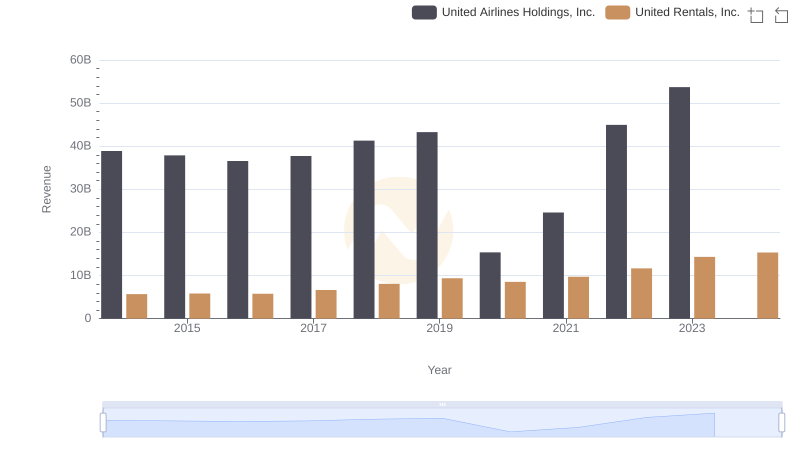
United Rentals, Inc. vs United Airlines Holdings, Inc.: Examining Key Revenue Metrics
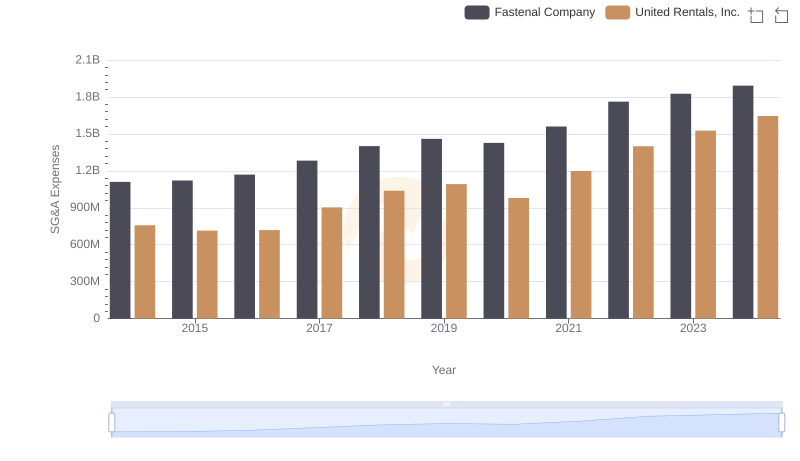
Selling, General, and Administrative Costs: United Rentals, Inc. vs Fastenal Company
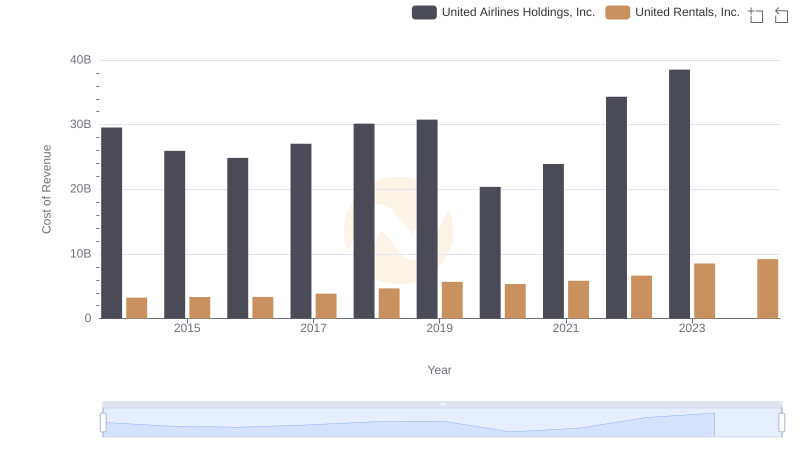
Cost Insights: Breaking Down United Rentals, Inc. and United Airlines Holdings, Inc.'s Expenses
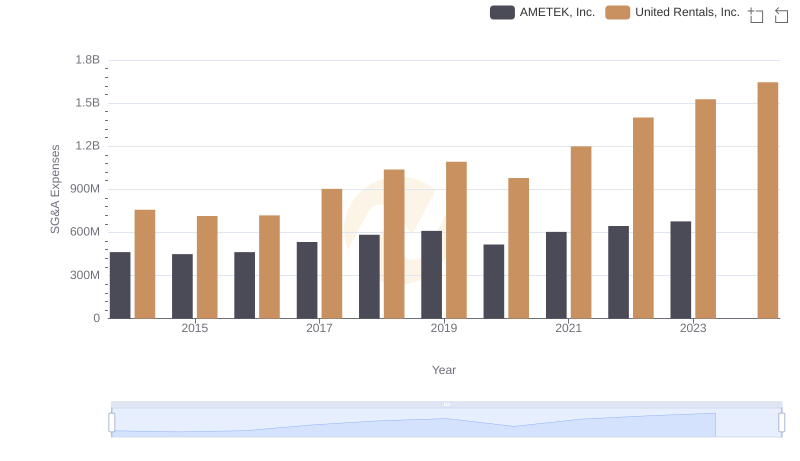
United Rentals, Inc. vs AMETEK, Inc.: SG&A Expense Trends
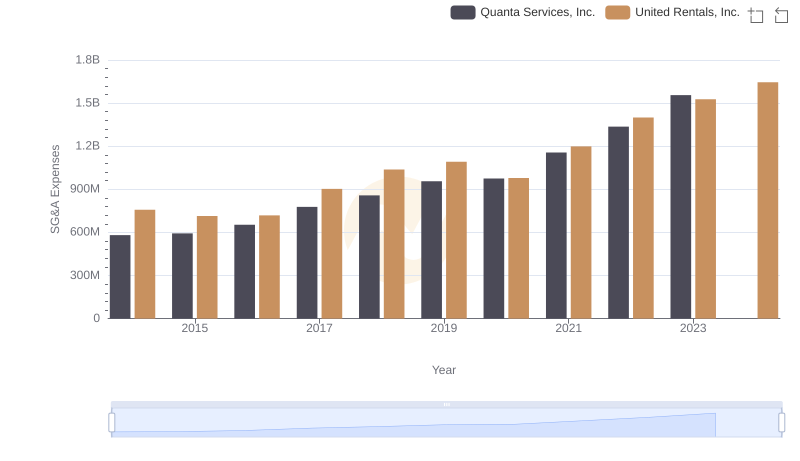
United Rentals, Inc. and Quanta Services, Inc.: SG&A Spending Patterns Compared
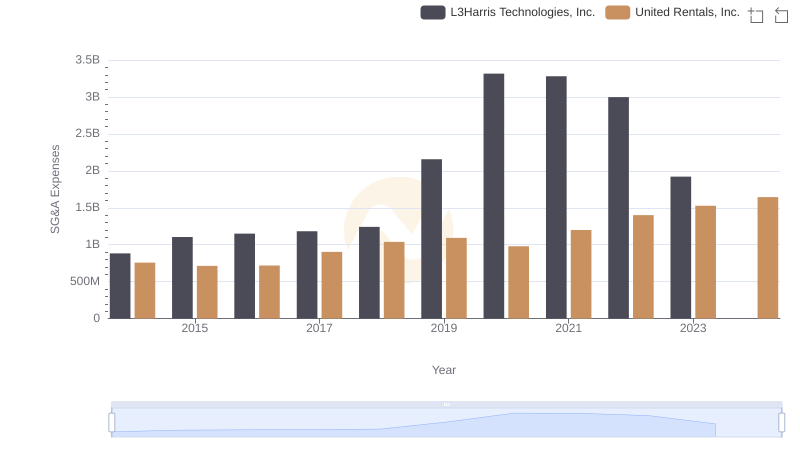
United Rentals, Inc. vs L3Harris Technologies, Inc.: SG&A Expense Trends
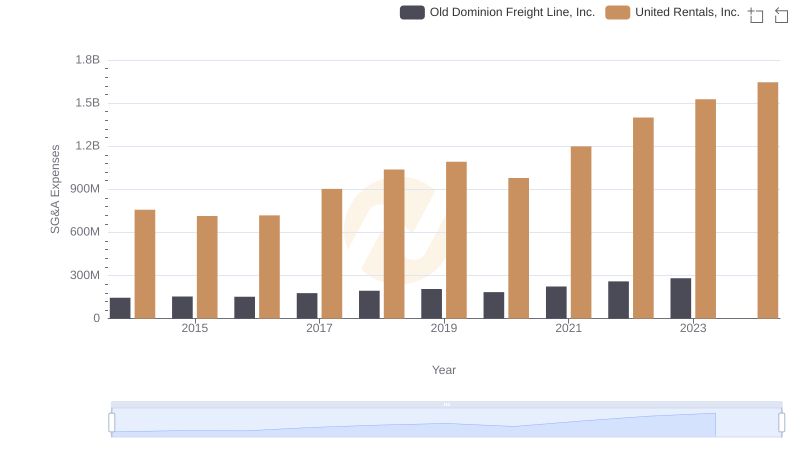
Cost Management Insights: SG&A Expenses for United Rentals, Inc. and Old Dominion Freight Line, Inc.
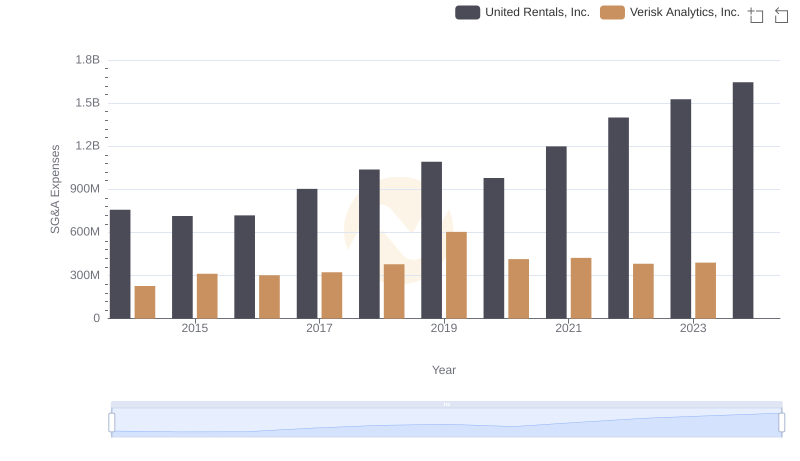
Operational Costs Compared: SG&A Analysis of United Rentals, Inc. and Verisk Analytics, Inc.
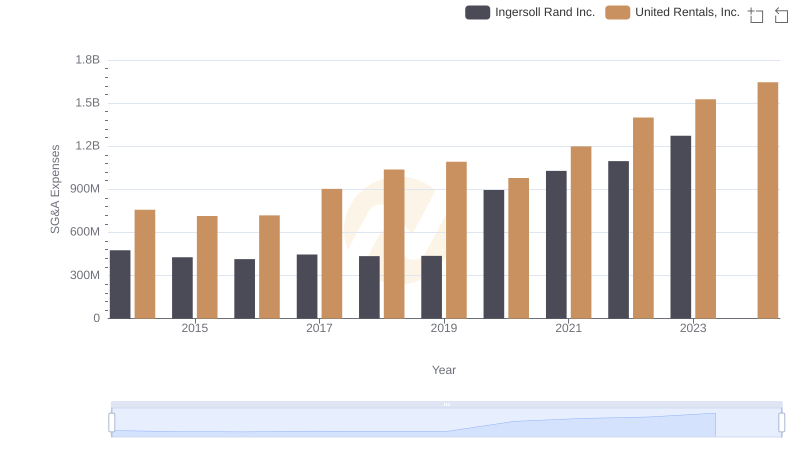
United Rentals, Inc. and Ingersoll Rand Inc.: SG&A Spending Patterns Compared
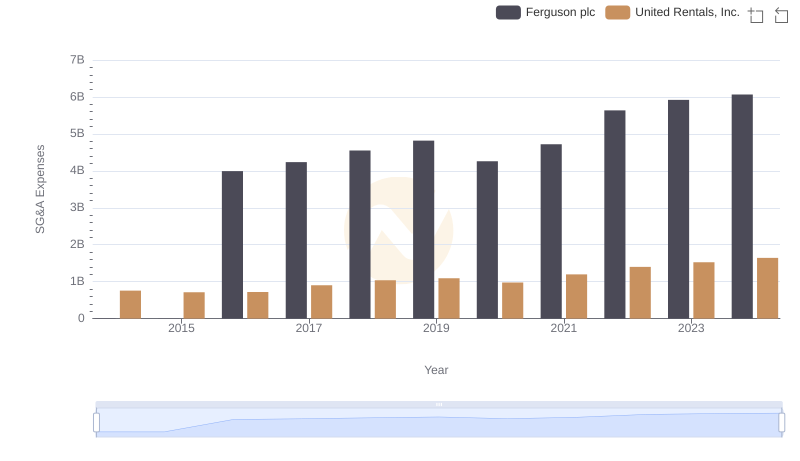
Comparing SG&A Expenses: United Rentals, Inc. vs Ferguson plc Trends and Insights
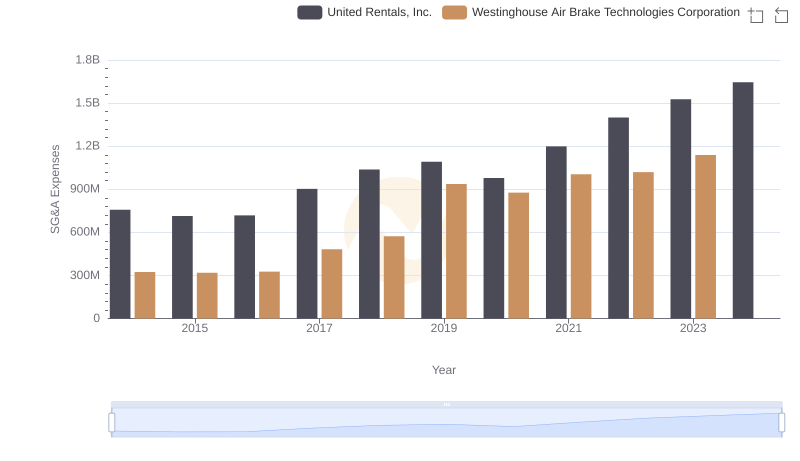
Cost Management Insights: SG&A Expenses for United Rentals, Inc. and Westinghouse Air Brake Technologies Corporation
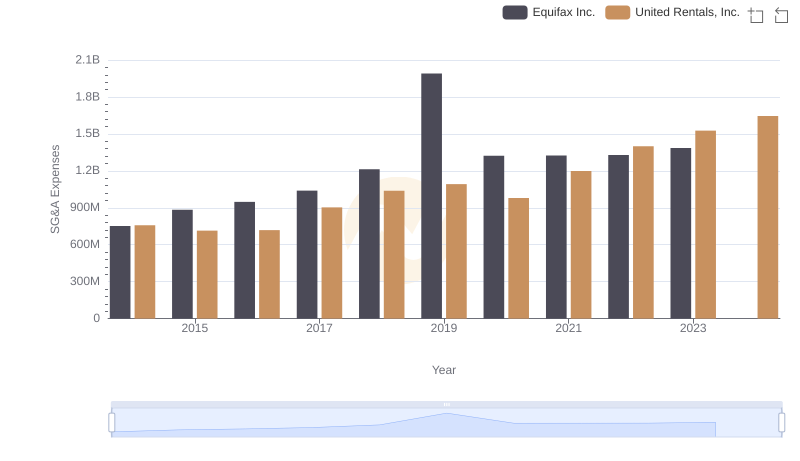
United Rentals, Inc. vs Equifax Inc.: SG&A Expense Trends