| __timestamp | Fastenal Company | United Rentals, Inc. |
|---|---|---|
| Wednesday, January 1, 2014 | 3733507000 | 5685000000 |
| Thursday, January 1, 2015 | 3869187000 | 5817000000 |
| Friday, January 1, 2016 | 3962036000 | 5762000000 |
| Sunday, January 1, 2017 | 4390500000 | 6641000000 |
| Monday, January 1, 2018 | 4965100000 | 8047000000 |
| Tuesday, January 1, 2019 | 5333700000 | 9351000000 |
| Wednesday, January 1, 2020 | 5647300000 | 8530000000 |
| Friday, January 1, 2021 | 6010900000 | 9716000000 |
| Saturday, January 1, 2022 | 6980600000 | 11642000000 |
| Sunday, January 1, 2023 | 7346700000 | 14332000000 |
| Monday, January 1, 2024 | 7546000000 | 15345000000 |
Data in motion
In the competitive landscape of industrial services, United Rentals, Inc. and Fastenal Company have been key players. Over the past decade, United Rentals has consistently outpaced Fastenal in revenue growth. From 2014 to 2024, United Rentals saw its revenue surge by approximately 170%, reaching a peak of $15.3 billion in 2024. In contrast, Fastenal's revenue grew by about 102% during the same period, culminating in $7.5 billion in 2024.
United Rentals' strategic acquisitions and expansion into new markets have fueled its impressive growth. Meanwhile, Fastenal has focused on enhancing its supply chain and expanding its product offerings. Despite these efforts, Fastenal's revenue remains about half of United Rentals'. This revenue gap highlights the differing strategies and market positions of these two industrial giants. As we look to the future, the question remains: can Fastenal close the gap, or will United Rentals continue to dominate?

United Rentals, Inc. and Howmet Aerospace Inc.: A Comprehensive Revenue Analysis

Comparing Revenue Performance: United Rentals, Inc. or Waste Connections, Inc.?
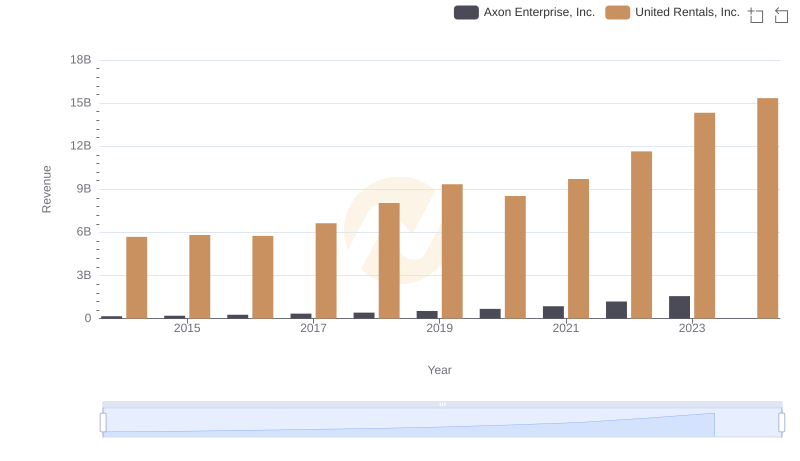
Breaking Down Revenue Trends: United Rentals, Inc. vs Axon Enterprise, Inc.
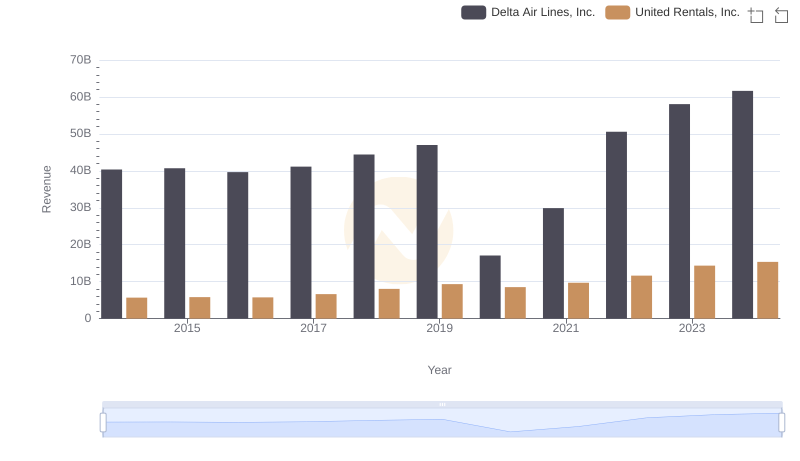
Revenue Insights: United Rentals, Inc. and Delta Air Lines, Inc. Performance Compared
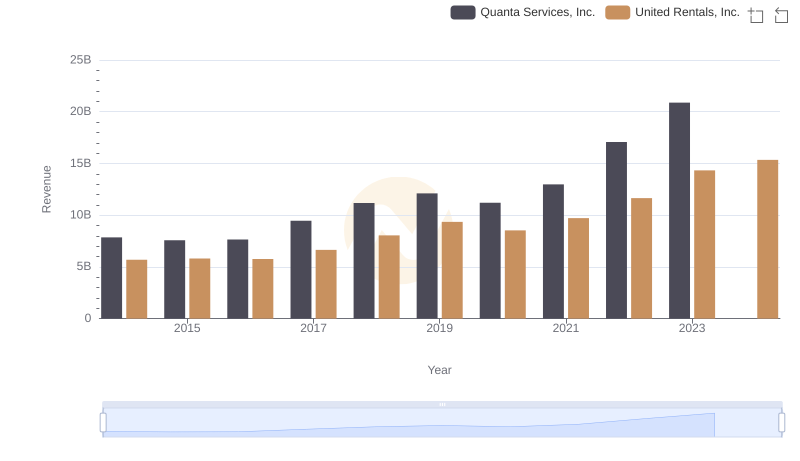
United Rentals, Inc. or Quanta Services, Inc.: Who Leads in Yearly Revenue?
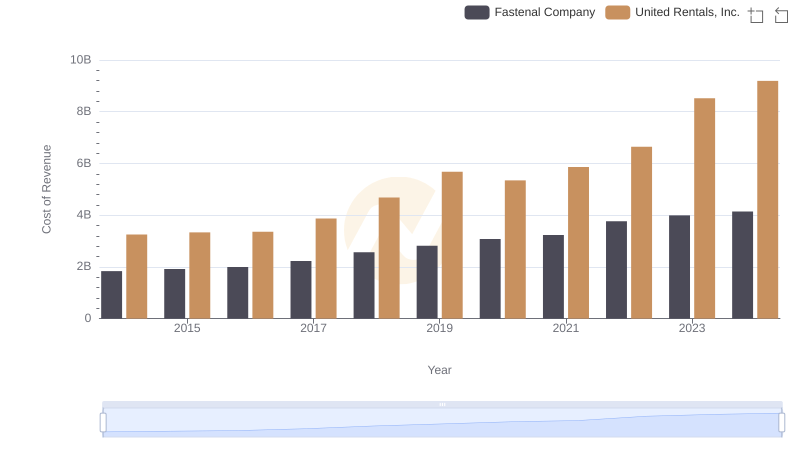
Cost Insights: Breaking Down United Rentals, Inc. and Fastenal Company's Expenses
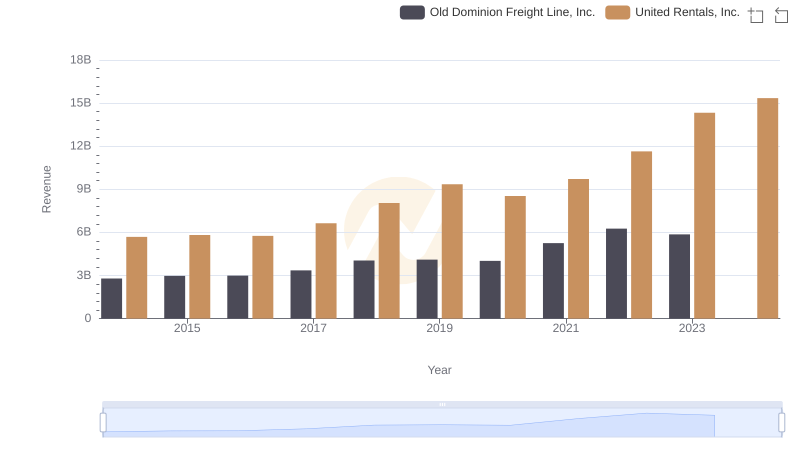
Who Generates More Revenue? United Rentals, Inc. or Old Dominion Freight Line, Inc.
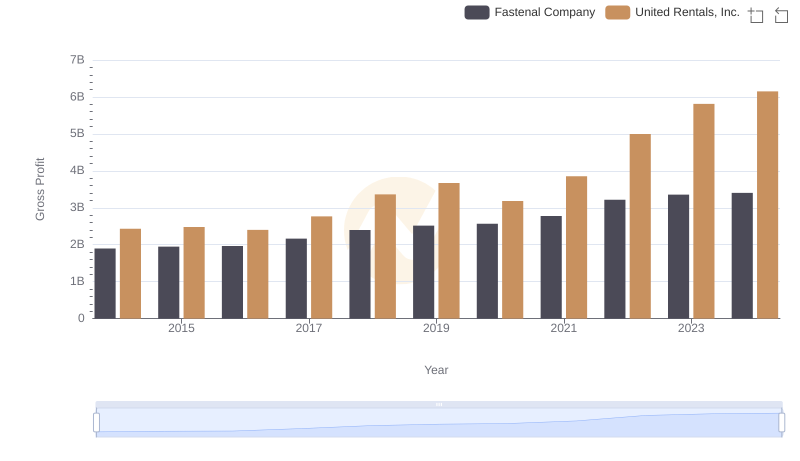
Gross Profit Comparison: United Rentals, Inc. and Fastenal Company Trends
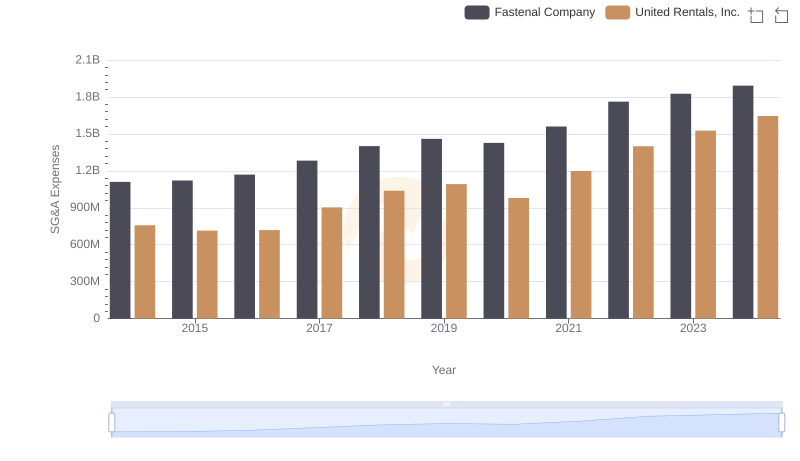
Selling, General, and Administrative Costs: United Rentals, Inc. vs Fastenal Company
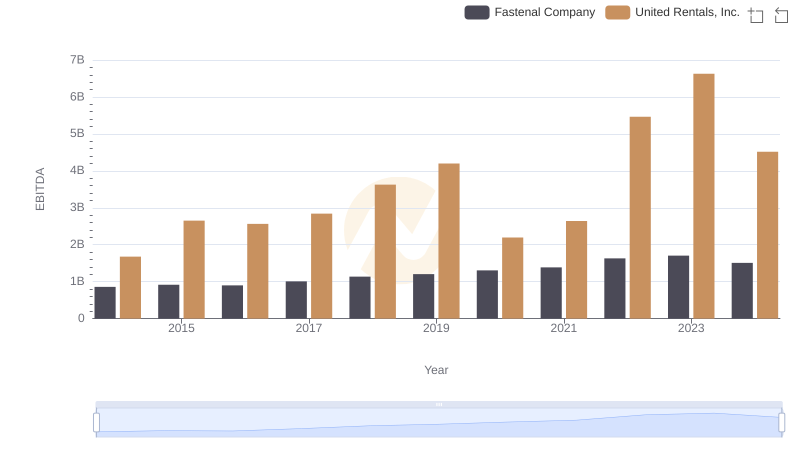
EBITDA Analysis: Evaluating United Rentals, Inc. Against Fastenal Company