| __timestamp | Fastenal Company | United Rentals, Inc. |
|---|---|---|
| Wednesday, January 1, 2014 | 859298000 | 1678000000 |
| Thursday, January 1, 2015 | 915726000 | 2653000000 |
| Friday, January 1, 2016 | 900285000 | 2566000000 |
| Sunday, January 1, 2017 | 1008200000 | 2843000000 |
| Monday, January 1, 2018 | 1136900000 | 3628000000 |
| Tuesday, January 1, 2019 | 1205900000 | 4200000000 |
| Wednesday, January 1, 2020 | 1304200000 | 2195000000 |
| Friday, January 1, 2021 | 1388200000 | 2642000000 |
| Saturday, January 1, 2022 | 1630900000 | 5464000000 |
| Sunday, January 1, 2023 | 1706000000 | 6627000000 |
| Monday, January 1, 2024 | 1510000000 | 4516000000 |
Infusing magic into the data realm
In the competitive landscape of industrial services, United Rentals, Inc. and Fastenal Company have showcased remarkable EBITDA growth over the past decade. From 2014 to 2023, United Rentals has consistently outperformed Fastenal, with its EBITDA growing by nearly 295%, peaking in 2023. This growth trajectory highlights United Rentals' strategic expansions and operational efficiencies. In contrast, Fastenal's EBITDA increased by approximately 99% during the same period, reflecting steady growth in its core business operations.
This analysis underscores the dynamic nature of the industrial sector, where strategic decisions and market conditions play pivotal roles in shaping financial outcomes.
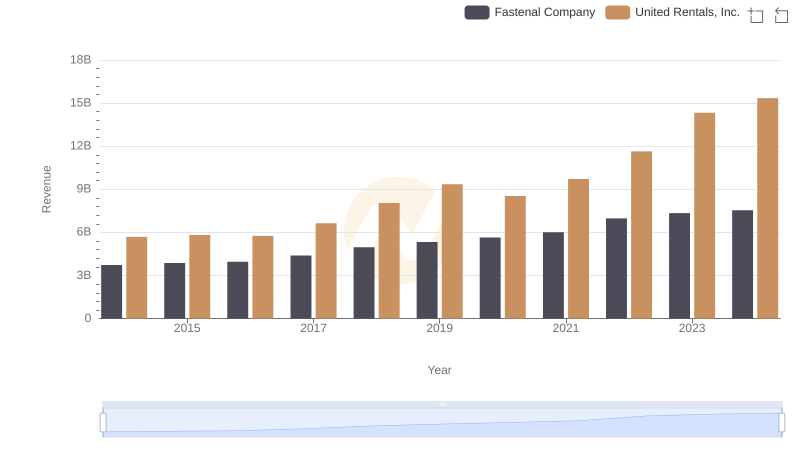
Revenue Showdown: United Rentals, Inc. vs Fastenal Company
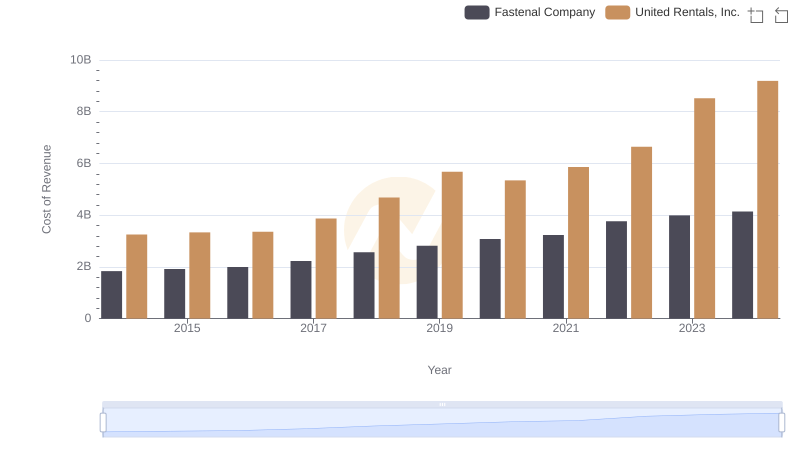
Cost Insights: Breaking Down United Rentals, Inc. and Fastenal Company's Expenses
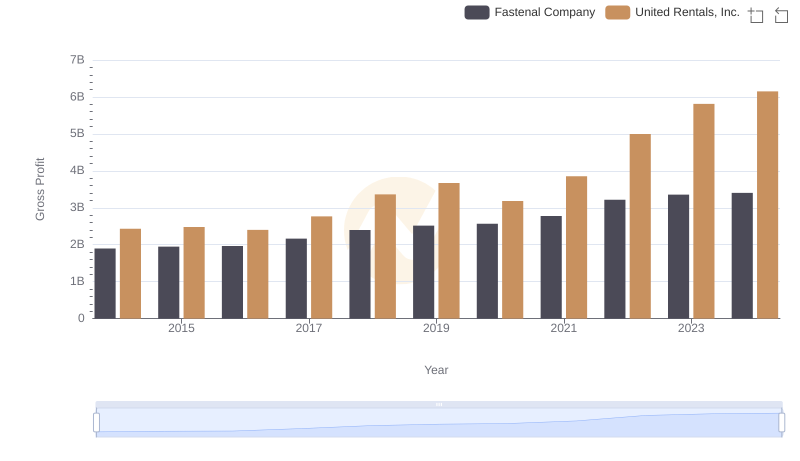
Gross Profit Comparison: United Rentals, Inc. and Fastenal Company Trends
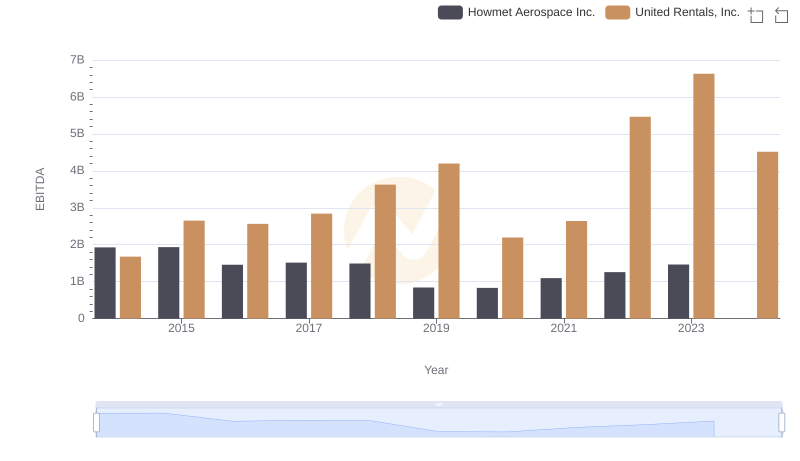
A Side-by-Side Analysis of EBITDA: United Rentals, Inc. and Howmet Aerospace Inc.
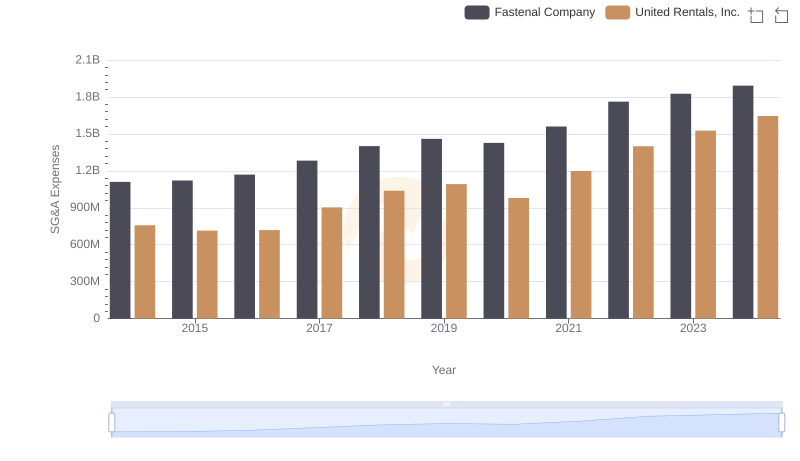
Selling, General, and Administrative Costs: United Rentals, Inc. vs Fastenal Company
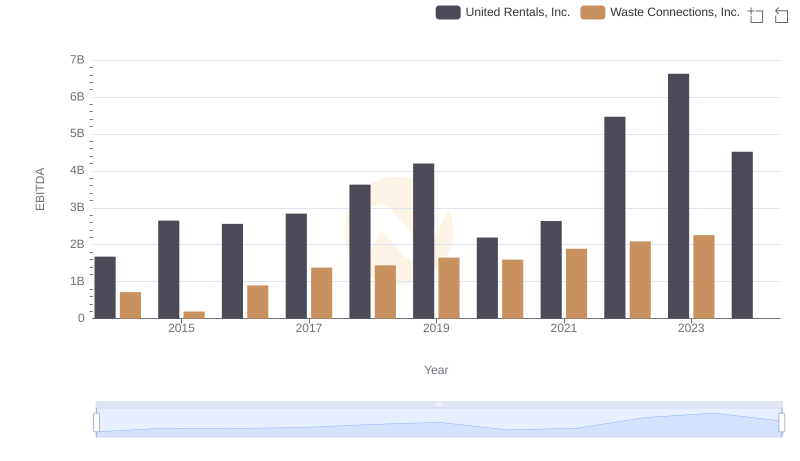
Comparative EBITDA Analysis: United Rentals, Inc. vs Waste Connections, Inc.
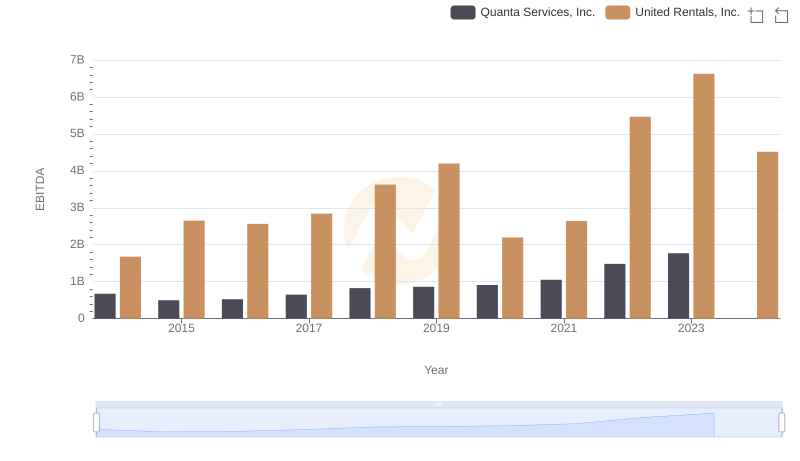
Comprehensive EBITDA Comparison: United Rentals, Inc. vs Quanta Services, Inc.
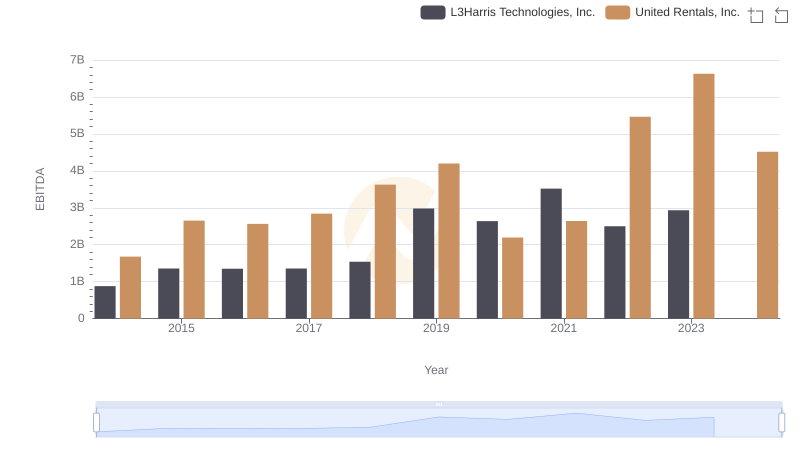
A Professional Review of EBITDA: United Rentals, Inc. Compared to L3Harris Technologies, Inc.
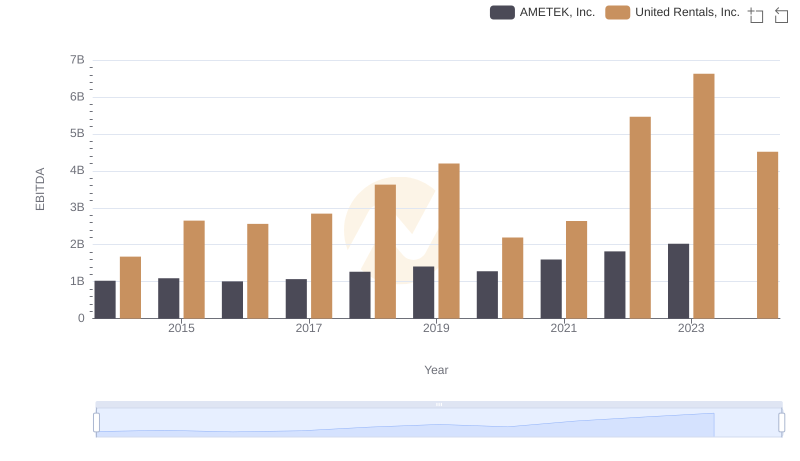
A Side-by-Side Analysis of EBITDA: United Rentals, Inc. and AMETEK, Inc.
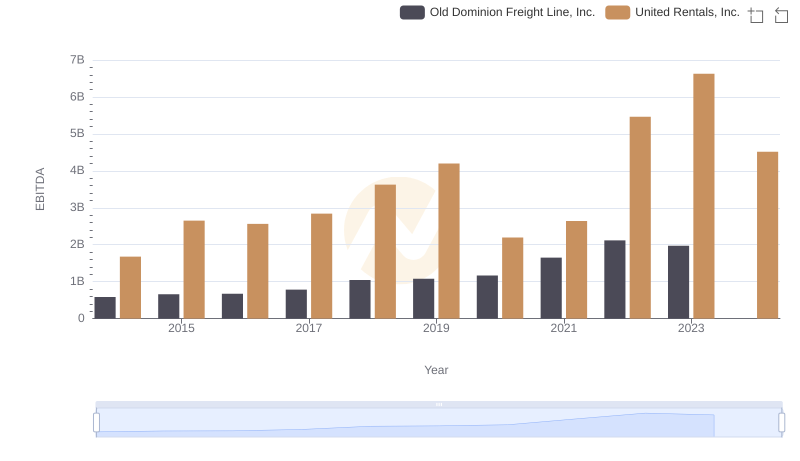
Professional EBITDA Benchmarking: United Rentals, Inc. vs Old Dominion Freight Line, Inc.
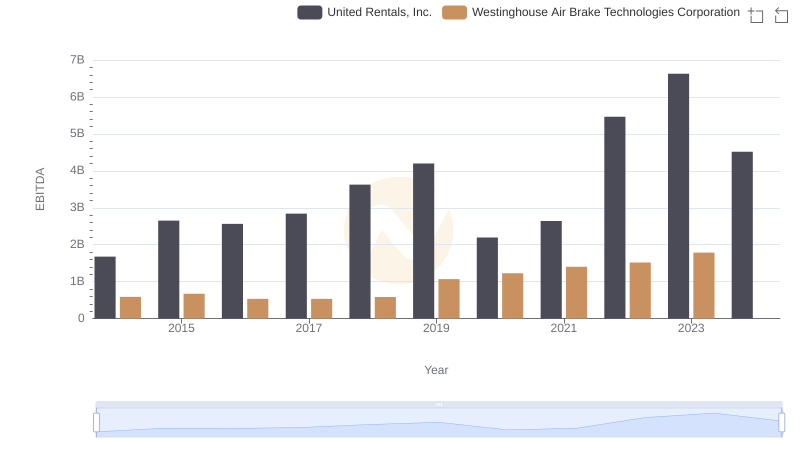
EBITDA Analysis: Evaluating United Rentals, Inc. Against Westinghouse Air Brake Technologies Corporation
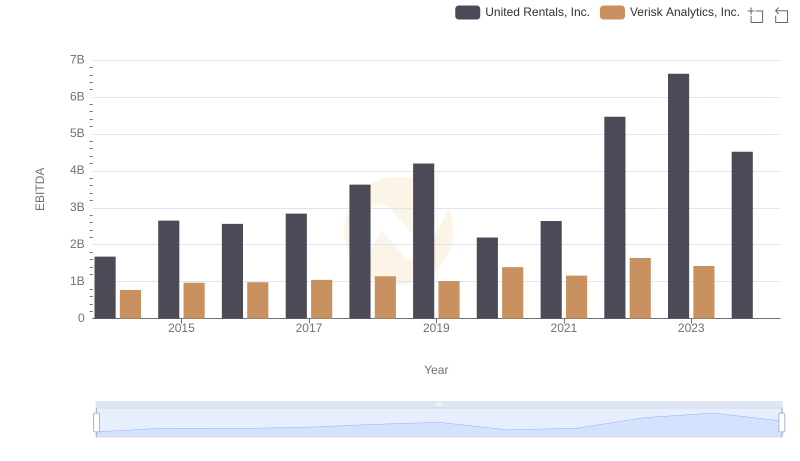
United Rentals, Inc. and Verisk Analytics, Inc.: A Detailed Examination of EBITDA Performance