| __timestamp | Fastenal Company | United Rentals, Inc. |
|---|---|---|
| Wednesday, January 1, 2014 | 1897402000 | 2432000000 |
| Thursday, January 1, 2015 | 1948934000 | 2480000000 |
| Friday, January 1, 2016 | 1964777000 | 2403000000 |
| Sunday, January 1, 2017 | 2163600000 | 2769000000 |
| Monday, January 1, 2018 | 2398900000 | 3364000000 |
| Tuesday, January 1, 2019 | 2515400000 | 3670000000 |
| Wednesday, January 1, 2020 | 2567800000 | 3183000000 |
| Friday, January 1, 2021 | 2777200000 | 3853000000 |
| Saturday, January 1, 2022 | 3215800000 | 4996000000 |
| Sunday, January 1, 2023 | 3354500000 | 5813000000 |
| Monday, January 1, 2024 | 3401900000 | 6150000000 |
Unveiling the hidden dimensions of data
In the competitive landscape of industrial equipment and supply, United Rentals, Inc. and Fastenal Company have shown remarkable growth over the past decade. From 2014 to 2024, United Rentals' gross profit surged by approximately 153%, while Fastenal's increased by about 79%. This growth trajectory highlights United Rentals' aggressive expansion strategy, outpacing Fastenal in terms of profit growth.
This data underscores the dynamic nature of the industrial sector and the strategic maneuvers companies must make to stay ahead.
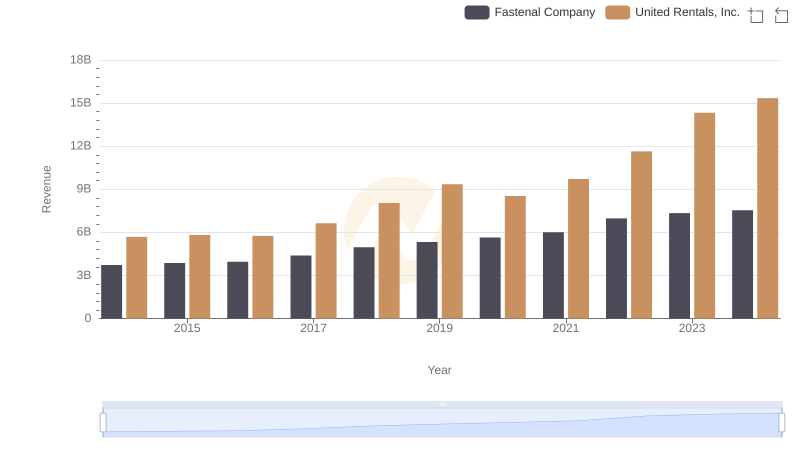
Revenue Showdown: United Rentals, Inc. vs Fastenal Company
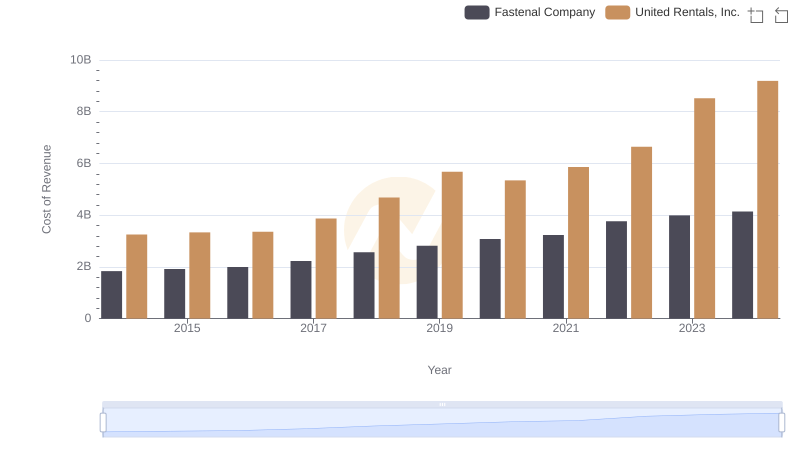
Cost Insights: Breaking Down United Rentals, Inc. and Fastenal Company's Expenses
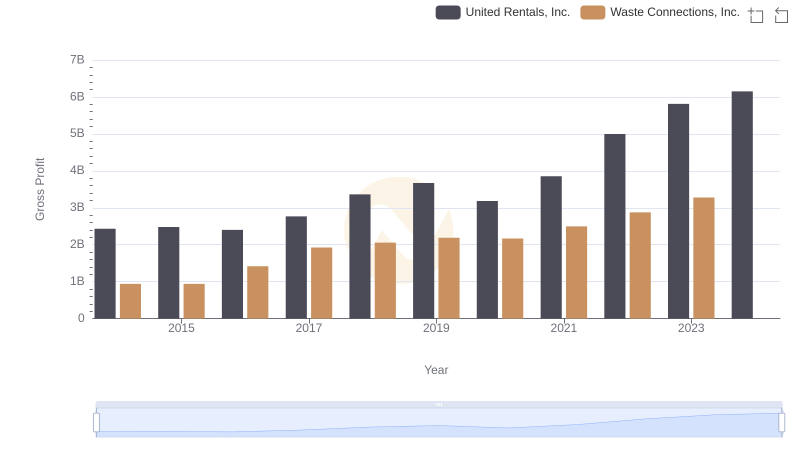
Gross Profit Trends Compared: United Rentals, Inc. vs Waste Connections, Inc.
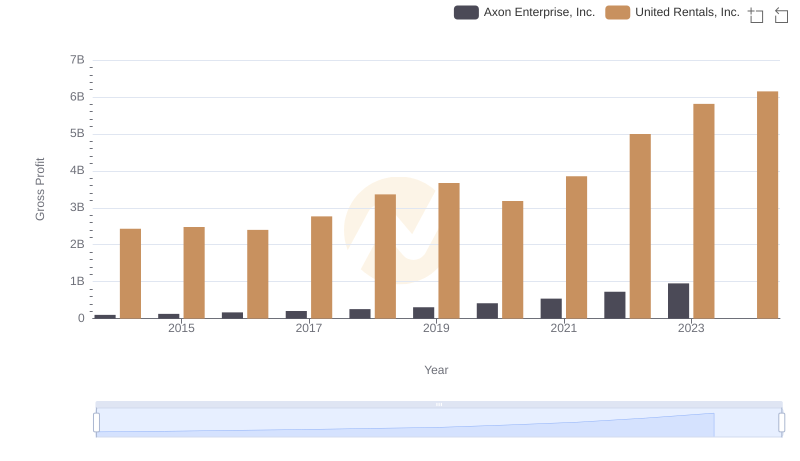
United Rentals, Inc. vs Axon Enterprise, Inc.: A Gross Profit Performance Breakdown
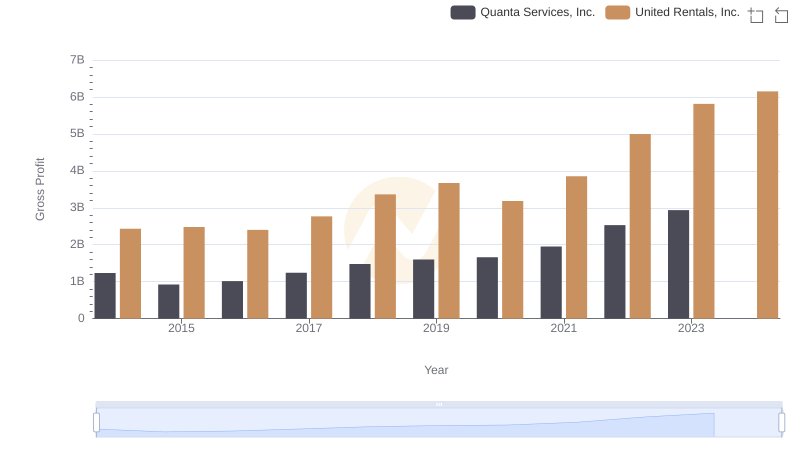
Gross Profit Comparison: United Rentals, Inc. and Quanta Services, Inc. Trends
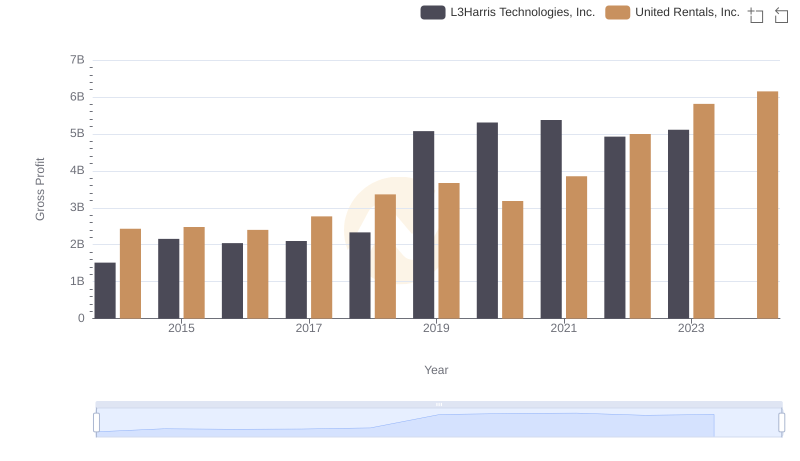
United Rentals, Inc. vs L3Harris Technologies, Inc.: A Gross Profit Performance Breakdown
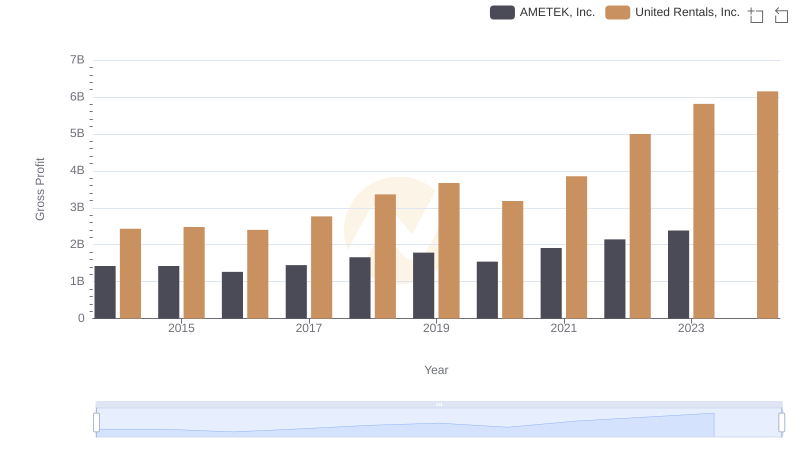
Gross Profit Analysis: Comparing United Rentals, Inc. and AMETEK, Inc.
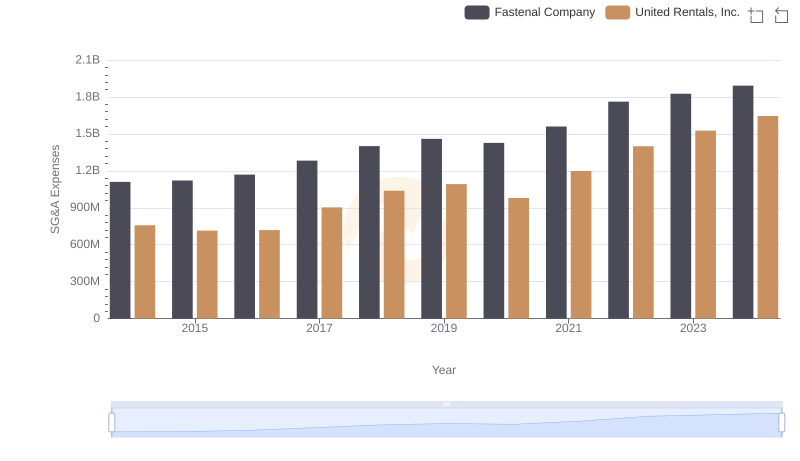
Selling, General, and Administrative Costs: United Rentals, Inc. vs Fastenal Company
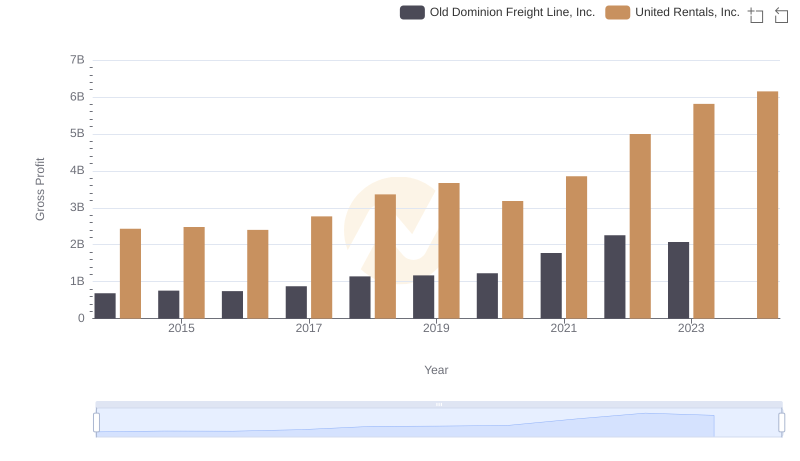
Gross Profit Comparison: United Rentals, Inc. and Old Dominion Freight Line, Inc. Trends
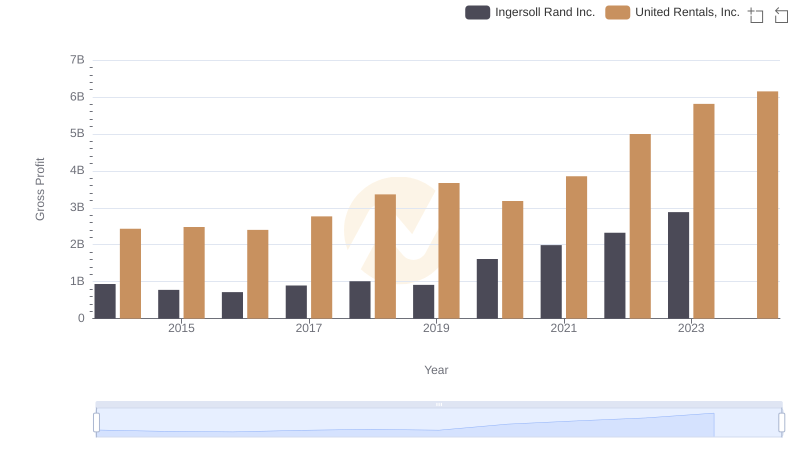
United Rentals, Inc. and Ingersoll Rand Inc.: A Detailed Gross Profit Analysis
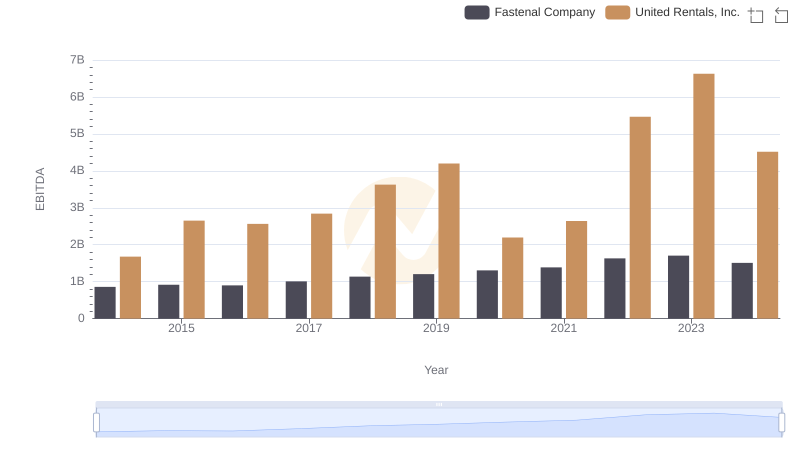
EBITDA Analysis: Evaluating United Rentals, Inc. Against Fastenal Company