| __timestamp | Lennox International Inc. | Pool Corporation |
|---|---|---|
| Wednesday, January 1, 2014 | 387700000 | 204752000 |
| Thursday, January 1, 2015 | 423600000 | 233610000 |
| Friday, January 1, 2016 | 490800000 | 277836000 |
| Sunday, January 1, 2017 | 562900000 | 310096000 |
| Monday, January 1, 2018 | 575200000 | 341804000 |
| Tuesday, January 1, 2019 | 633300000 | 370520000 |
| Wednesday, January 1, 2020 | 553900000 | 493425000 |
| Friday, January 1, 2021 | 652500000 | 862810000 |
| Saturday, January 1, 2022 | 729000000 | 1064808000 |
| Sunday, January 1, 2023 | 879500000 | 786707000 |
| Monday, January 1, 2024 | 1034800000 |
Unleashing the power of data
In the ever-evolving landscape of the HVAC and pool supply industries, Lennox International Inc. and Pool Corporation have demonstrated remarkable EBITDA growth over the past decade. From 2014 to 2023, Lennox International Inc. saw its EBITDA surge by approximately 167%, peaking at over $1 billion in 2024. This growth underscores Lennox's strategic focus on innovation and efficiency.
Meanwhile, Pool Corporation, a leader in the pool supply sector, experienced a significant 385% increase in EBITDA from 2014 to 2022, reaching a high of $1.06 billion. However, 2023 saw a slight dip, highlighting potential market challenges or strategic shifts.
This analysis provides a compelling snapshot of how these industry giants have navigated economic fluctuations and market demands, offering valuable insights for investors and industry enthusiasts alike.
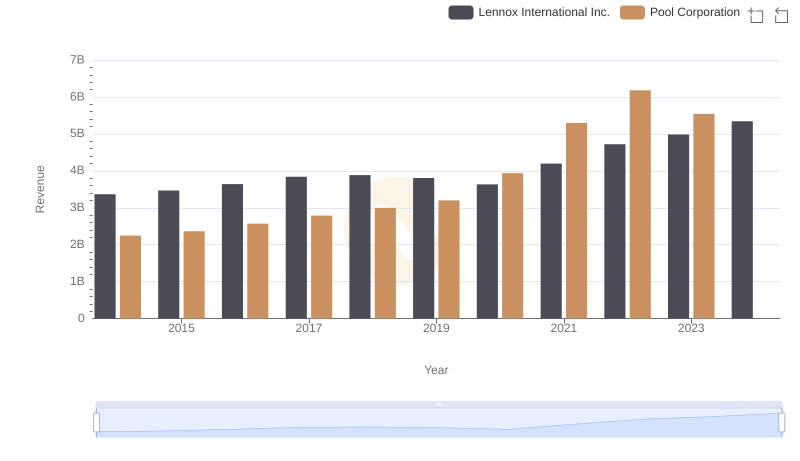
Lennox International Inc. vs Pool Corporation: Annual Revenue Growth Compared
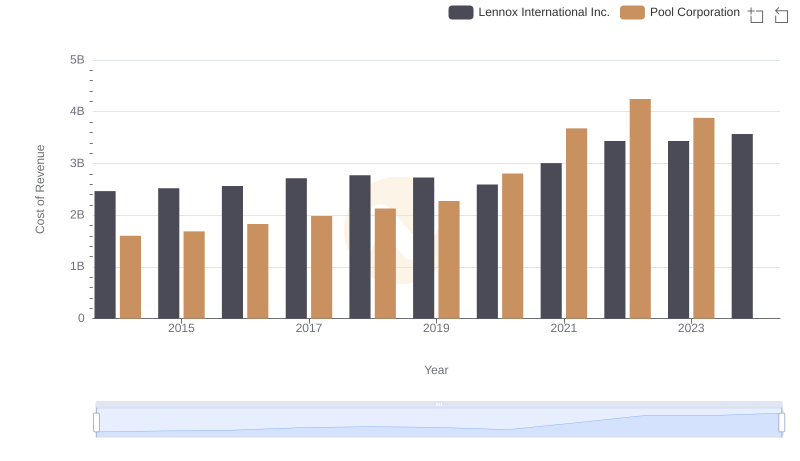
Comparing Cost of Revenue Efficiency: Lennox International Inc. vs Pool Corporation
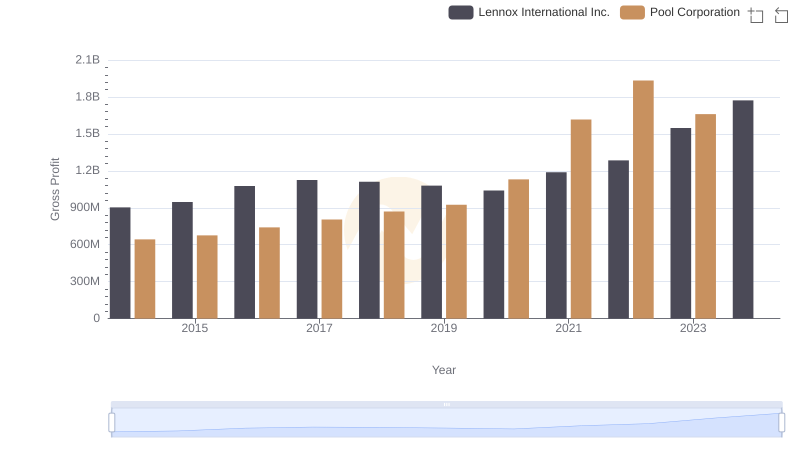
Key Insights on Gross Profit: Lennox International Inc. vs Pool Corporation
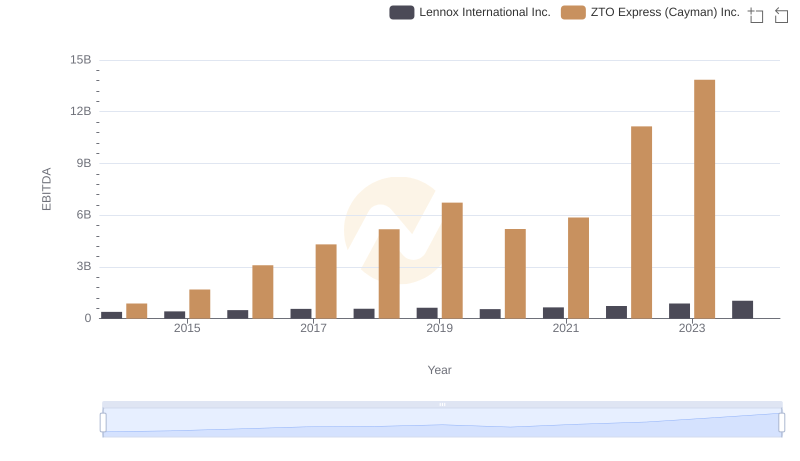
A Professional Review of EBITDA: Lennox International Inc. Compared to ZTO Express (Cayman) Inc.
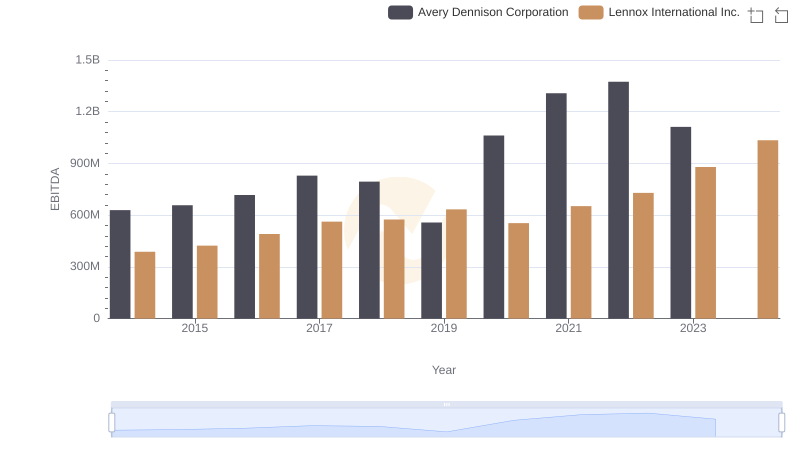
A Professional Review of EBITDA: Lennox International Inc. Compared to Avery Dennison Corporation
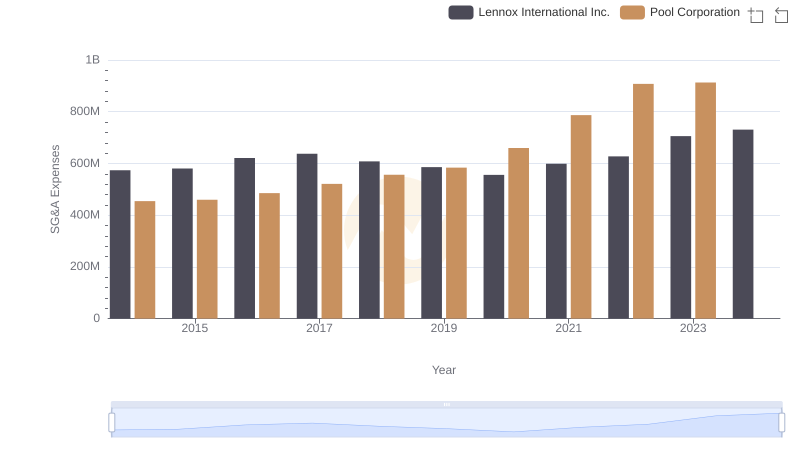
Selling, General, and Administrative Costs: Lennox International Inc. vs Pool Corporation
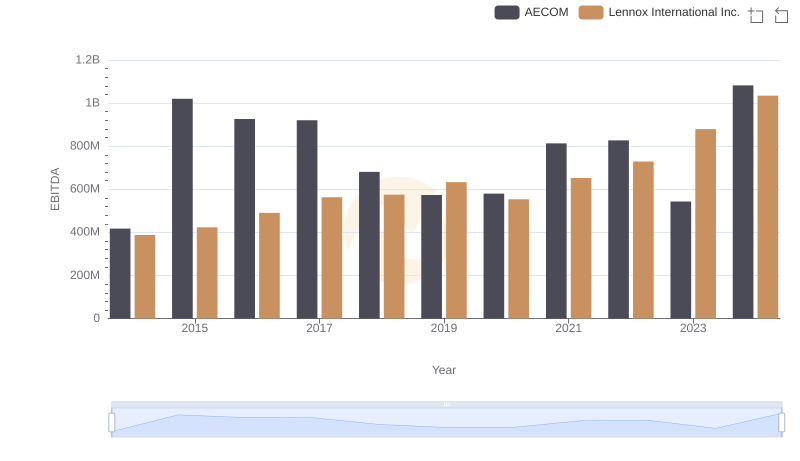
EBITDA Analysis: Evaluating Lennox International Inc. Against AECOM
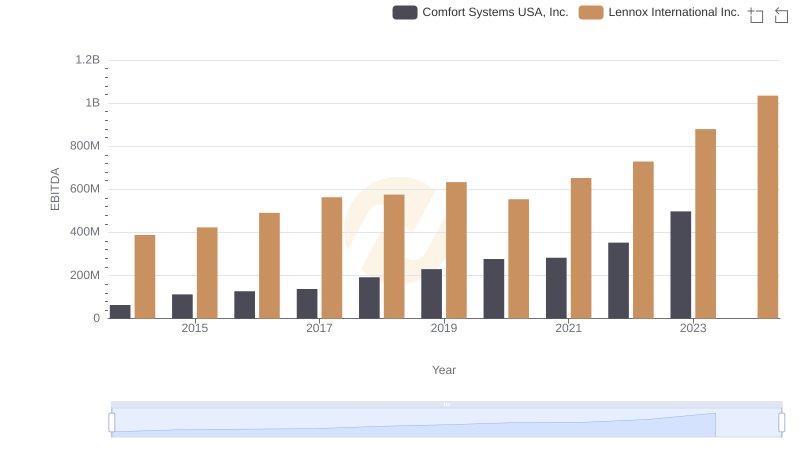
A Professional Review of EBITDA: Lennox International Inc. Compared to Comfort Systems USA, Inc.
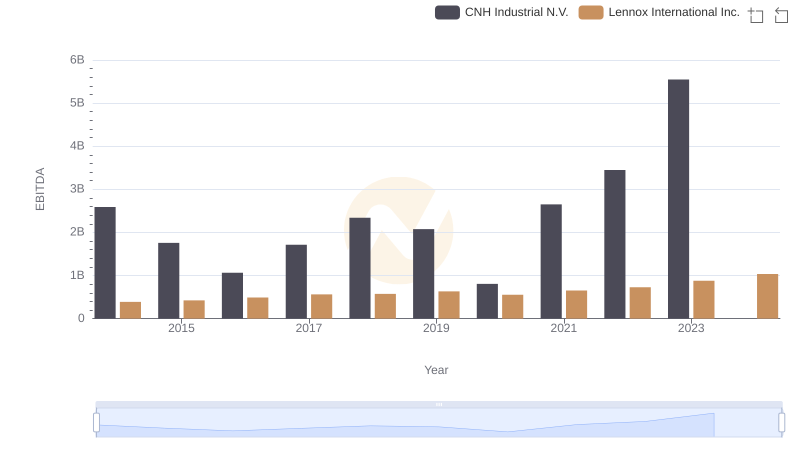
Comprehensive EBITDA Comparison: Lennox International Inc. vs CNH Industrial N.V.
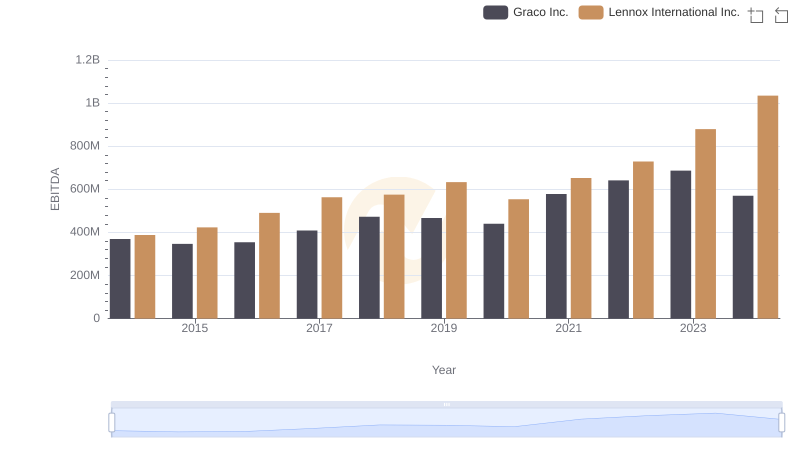
Comparative EBITDA Analysis: Lennox International Inc. vs Graco Inc.

Professional EBITDA Benchmarking: Lennox International Inc. vs Stanley Black & Decker, Inc.
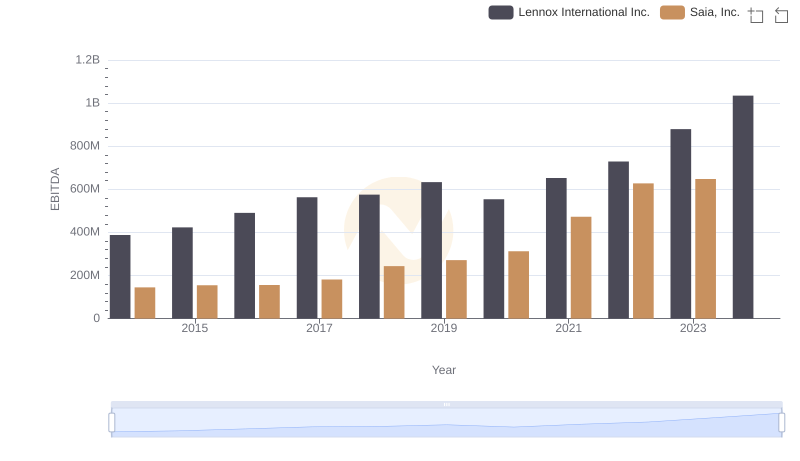
Comprehensive EBITDA Comparison: Lennox International Inc. vs Saia, Inc.