| __timestamp | Lennox International Inc. | Pool Corporation |
|---|---|---|
| Wednesday, January 1, 2014 | 2464100000 | 1603222000 |
| Thursday, January 1, 2015 | 2520000000 | 1687495000 |
| Friday, January 1, 2016 | 2565100000 | 1829716000 |
| Sunday, January 1, 2017 | 2714400000 | 1982899000 |
| Monday, January 1, 2018 | 2772700000 | 2127924000 |
| Tuesday, January 1, 2019 | 2727400000 | 2274592000 |
| Wednesday, January 1, 2020 | 2594000000 | 2805721000 |
| Friday, January 1, 2021 | 3005700000 | 3678492000 |
| Saturday, January 1, 2022 | 3433700000 | 4246315000 |
| Sunday, January 1, 2023 | 3434100000 | 3881551000 |
| Monday, January 1, 2024 | 3569400000 |
Unleashing insights
In the competitive landscape of HVAC and pool supply industries, Lennox International Inc. and Pool Corporation have been pivotal players. Over the past decade, Lennox International has demonstrated a steady increase in cost of revenue, peaking at approximately $3.57 billion in 2024, marking a 45% rise since 2014. Meanwhile, Pool Corporation has shown a remarkable 142% growth, reaching around $4.25 billion in 2022, before a slight dip in 2023. This trend highlights Pool Corporation's aggressive expansion strategy, especially during the pandemic years when their cost of revenue surpassed Lennox's. However, the absence of 2024 data for Pool Corporation leaves room for speculation on their future trajectory. As these companies continue to evolve, their cost efficiency strategies will be crucial in maintaining market leadership.
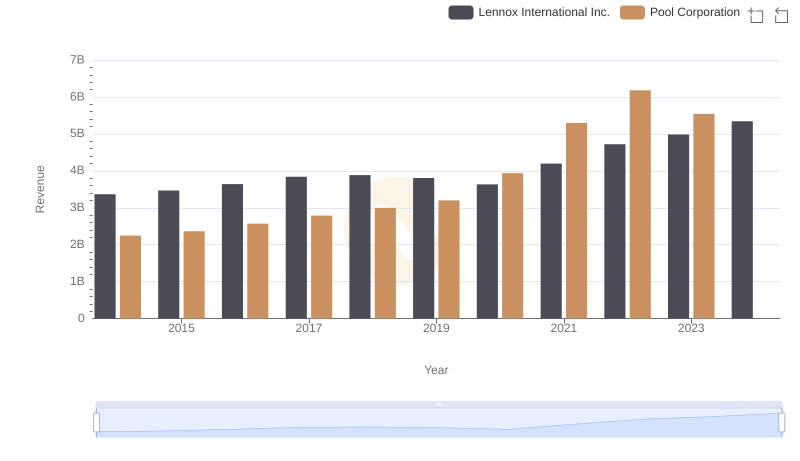
Lennox International Inc. vs Pool Corporation: Annual Revenue Growth Compared
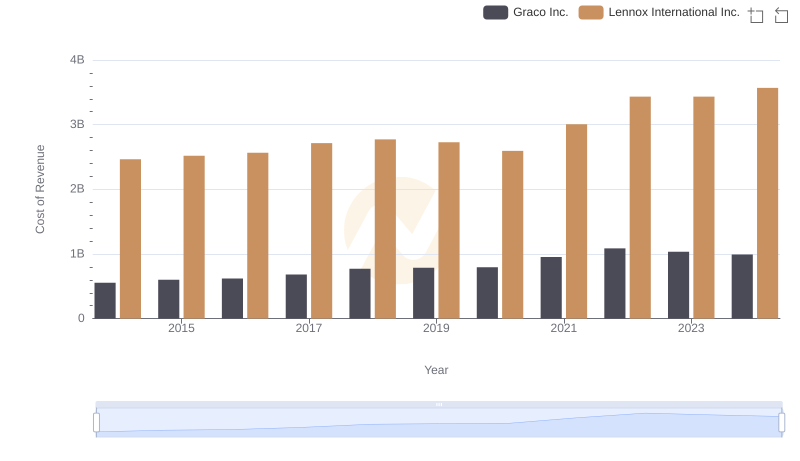
Cost of Revenue Comparison: Lennox International Inc. vs Graco Inc.
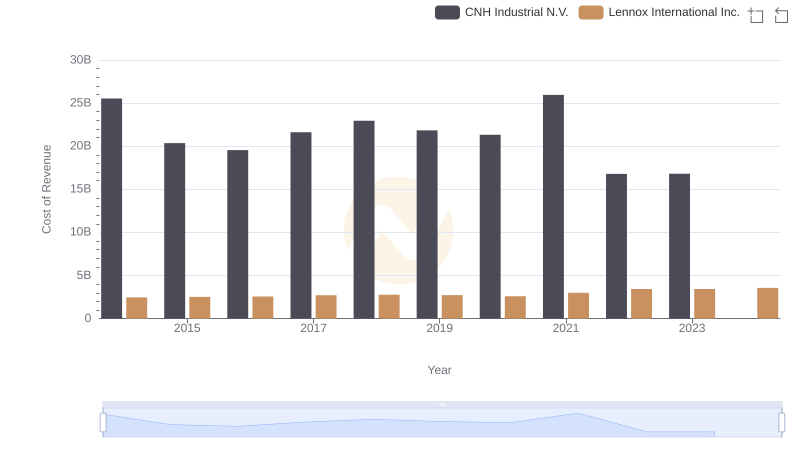
Cost of Revenue Trends: Lennox International Inc. vs CNH Industrial N.V.
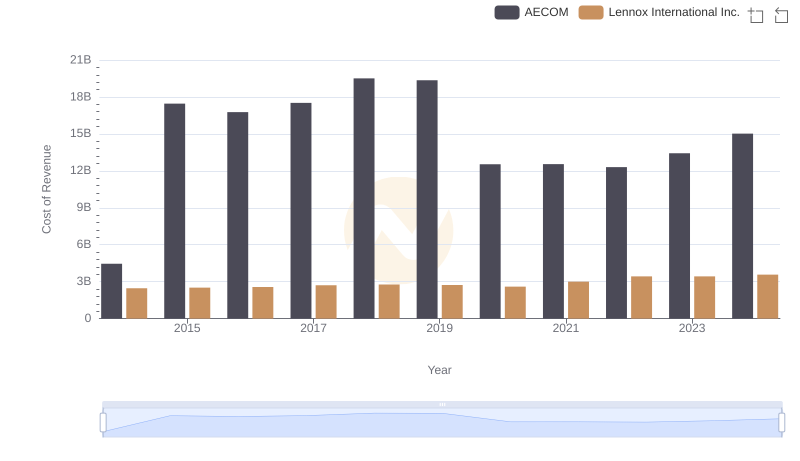
Cost of Revenue Trends: Lennox International Inc. vs AECOM
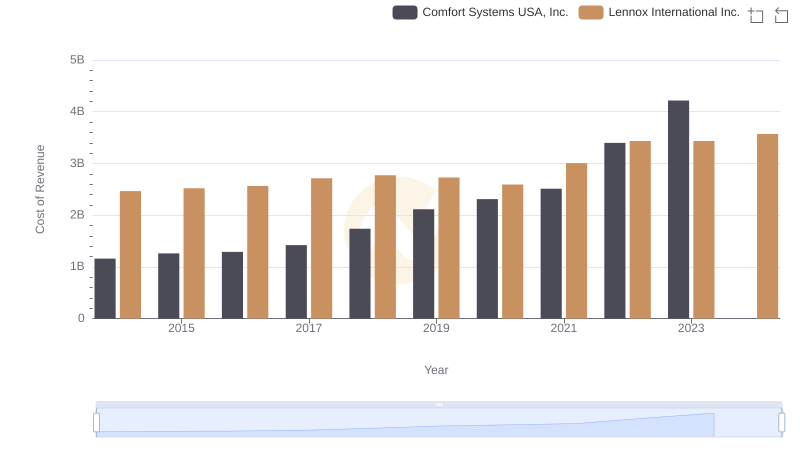
Cost of Revenue Trends: Lennox International Inc. vs Comfort Systems USA, Inc.
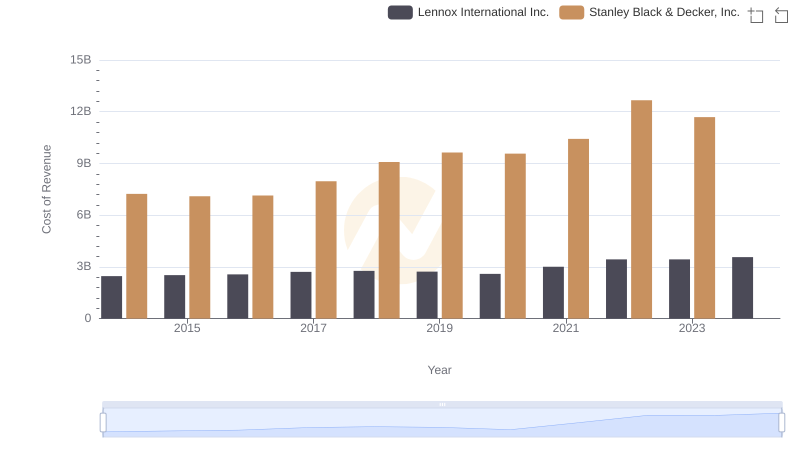
Analyzing Cost of Revenue: Lennox International Inc. and Stanley Black & Decker, Inc.
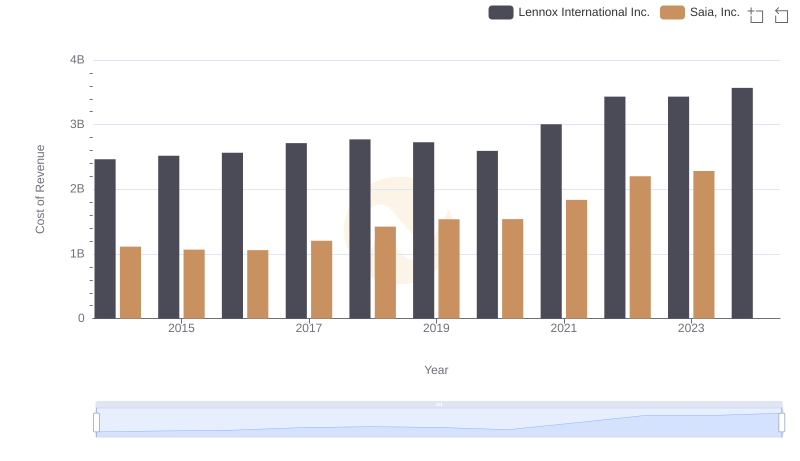
Cost Insights: Breaking Down Lennox International Inc. and Saia, Inc.'s Expenses
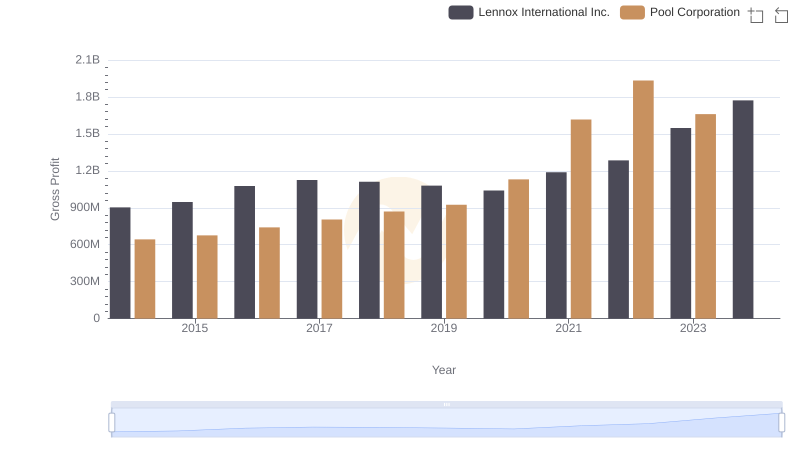
Key Insights on Gross Profit: Lennox International Inc. vs Pool Corporation
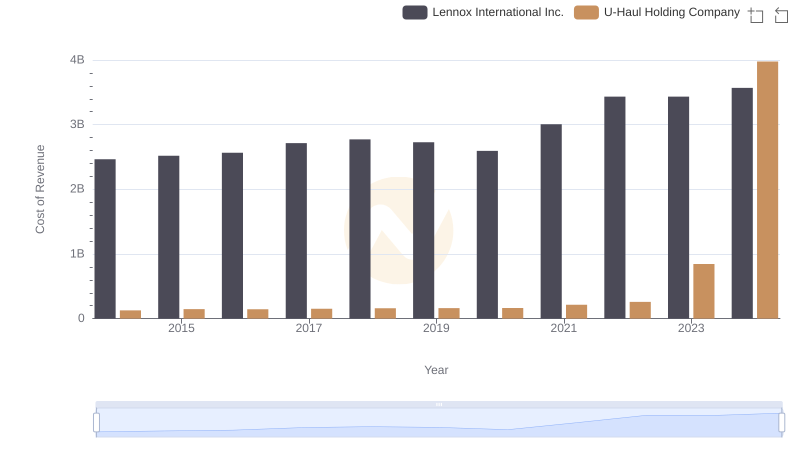
Cost Insights: Breaking Down Lennox International Inc. and U-Haul Holding Company's Expenses
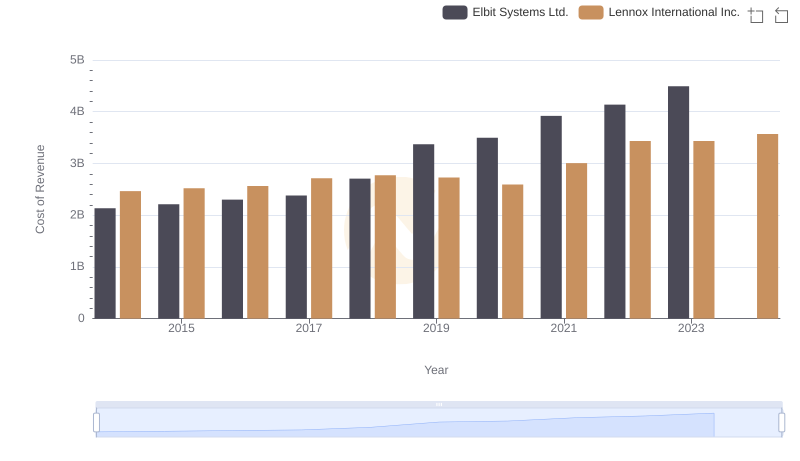
Cost of Revenue: Key Insights for Lennox International Inc. and Elbit Systems Ltd.
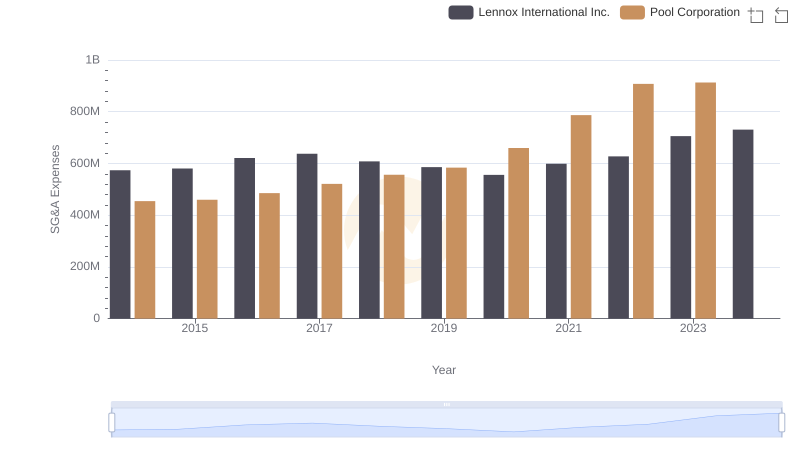
Selling, General, and Administrative Costs: Lennox International Inc. vs Pool Corporation
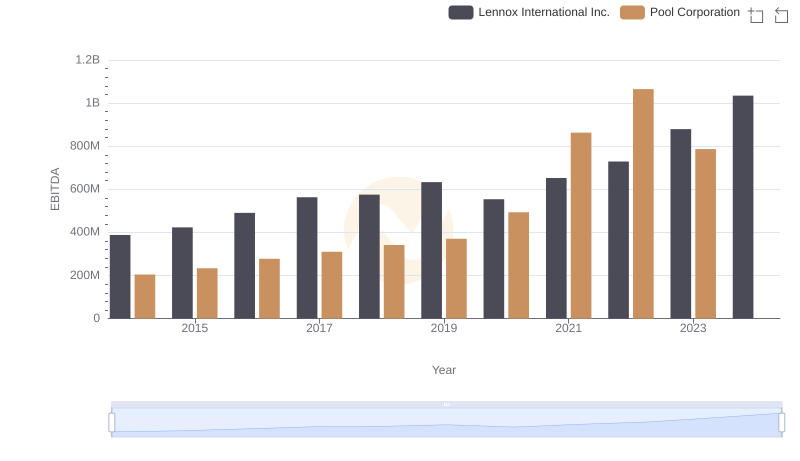
EBITDA Analysis: Evaluating Lennox International Inc. Against Pool Corporation