| __timestamp | Lennox International Inc. | Pool Corporation |
|---|---|---|
| Wednesday, January 1, 2014 | 903300000 | 643340000 |
| Thursday, January 1, 2015 | 947400000 | 675644000 |
| Friday, January 1, 2016 | 1076500000 | 741087000 |
| Sunday, January 1, 2017 | 1125200000 | 805289000 |
| Monday, January 1, 2018 | 1111200000 | 870173000 |
| Tuesday, January 1, 2019 | 1079800000 | 924925000 |
| Wednesday, January 1, 2020 | 1040100000 | 1130902000 |
| Friday, January 1, 2021 | 1188400000 | 1617092000 |
| Saturday, January 1, 2022 | 1284700000 | 1933412000 |
| Sunday, January 1, 2023 | 1547800000 | 1660044000 |
| Monday, January 1, 2024 | 1771900000 |
Unlocking the unknown
In the competitive landscape of the HVAC and pool supply industries, Lennox International Inc. and Pool Corporation have demonstrated remarkable growth in gross profit over the past decade. From 2014 to 2023, Lennox International Inc. saw its gross profit surge by approximately 96%, peaking at $1.77 billion in 2023. This growth reflects the company's strategic initiatives and market expansion.
Meanwhile, Pool Corporation, a leader in the pool supply sector, experienced a significant 158% increase in gross profit from 2014 to 2022, reaching a high of $1.93 billion. However, data for 2024 is currently unavailable, leaving room for speculation on future trends.
These insights highlight the resilience and adaptability of both companies in navigating market challenges and capitalizing on opportunities, making them key players in their respective industries.
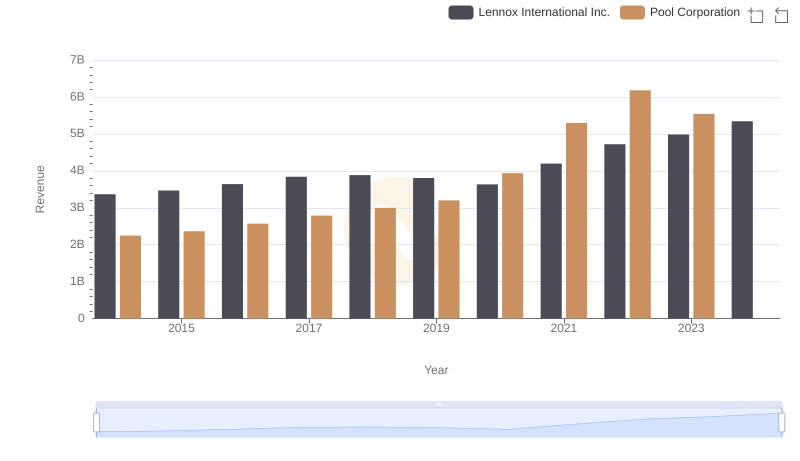
Lennox International Inc. vs Pool Corporation: Annual Revenue Growth Compared
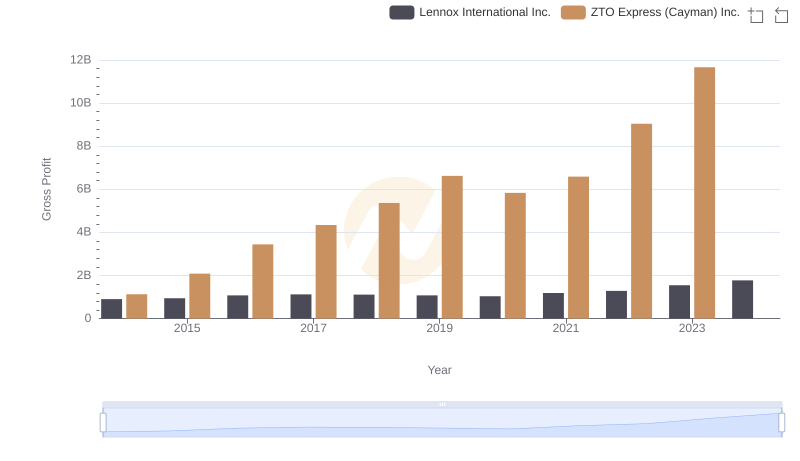
Gross Profit Comparison: Lennox International Inc. and ZTO Express (Cayman) Inc. Trends
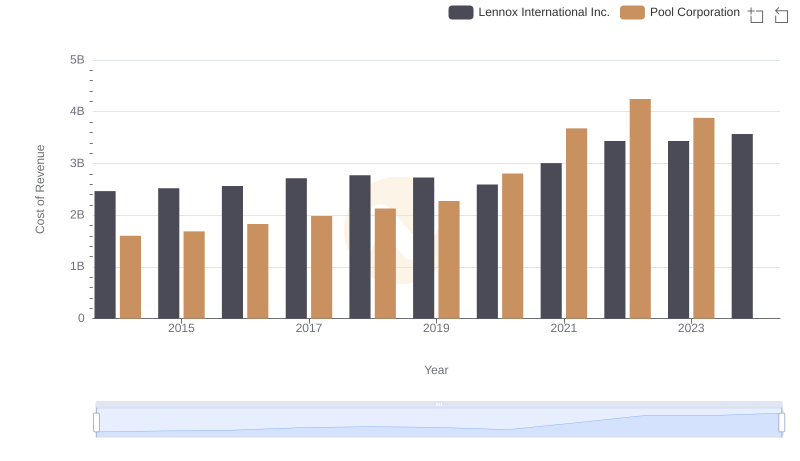
Comparing Cost of Revenue Efficiency: Lennox International Inc. vs Pool Corporation
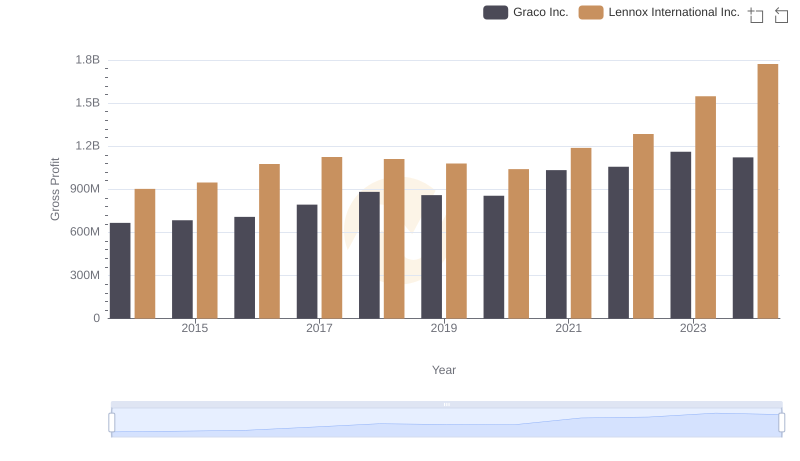
Lennox International Inc. and Graco Inc.: A Detailed Gross Profit Analysis
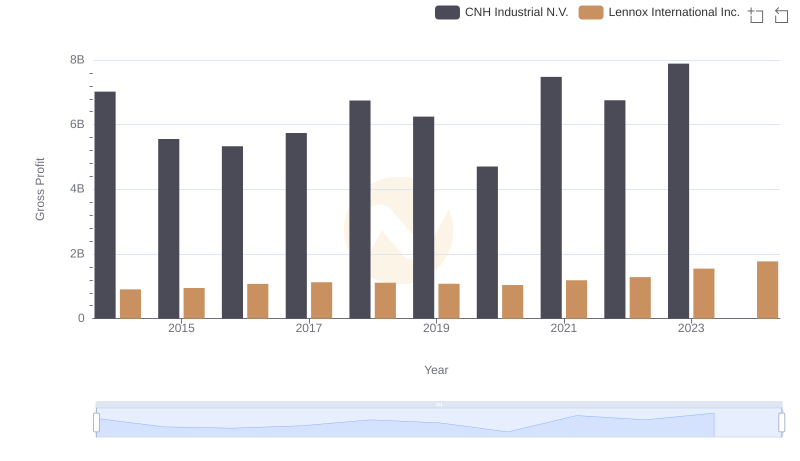
Lennox International Inc. and CNH Industrial N.V.: A Detailed Gross Profit Analysis
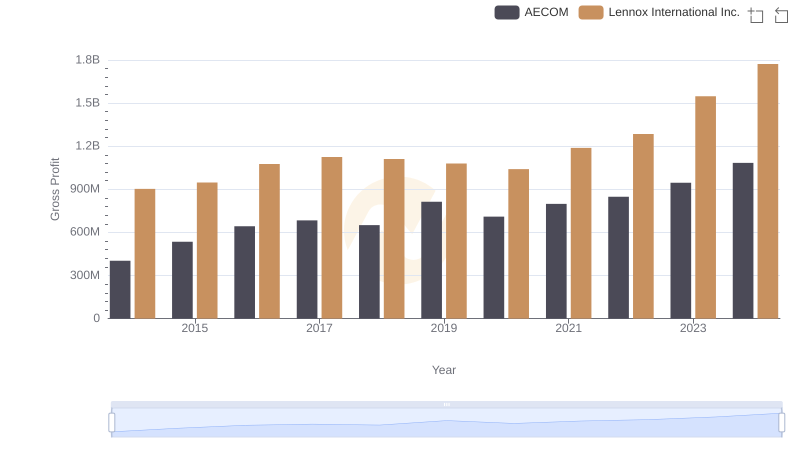
Lennox International Inc. vs AECOM: A Gross Profit Performance Breakdown
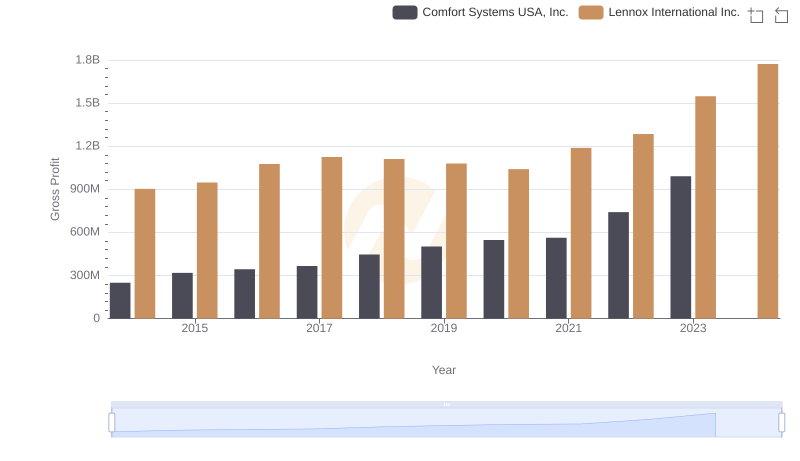
Lennox International Inc. and Comfort Systems USA, Inc.: A Detailed Gross Profit Analysis
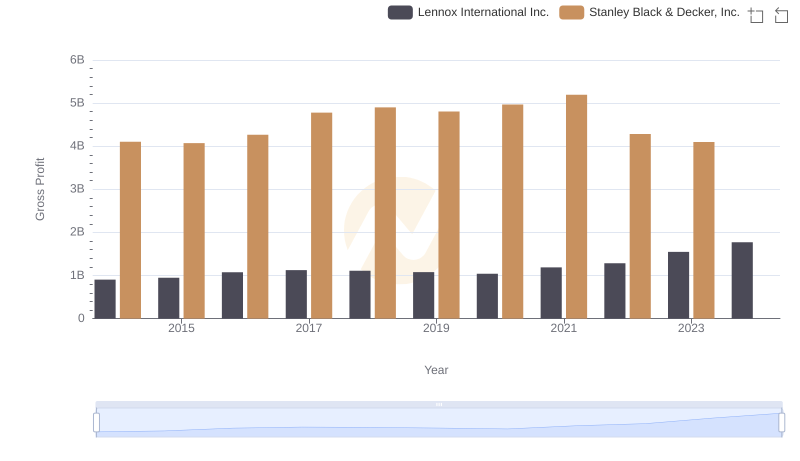
Lennox International Inc. vs Stanley Black & Decker, Inc.: A Gross Profit Performance Breakdown
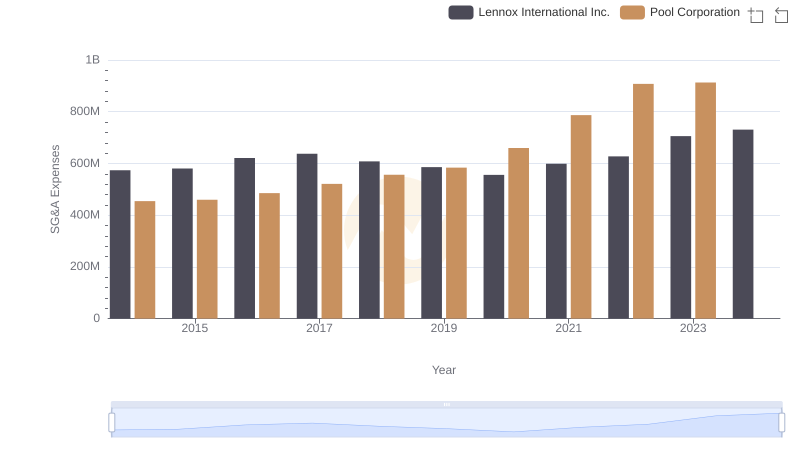
Selling, General, and Administrative Costs: Lennox International Inc. vs Pool Corporation
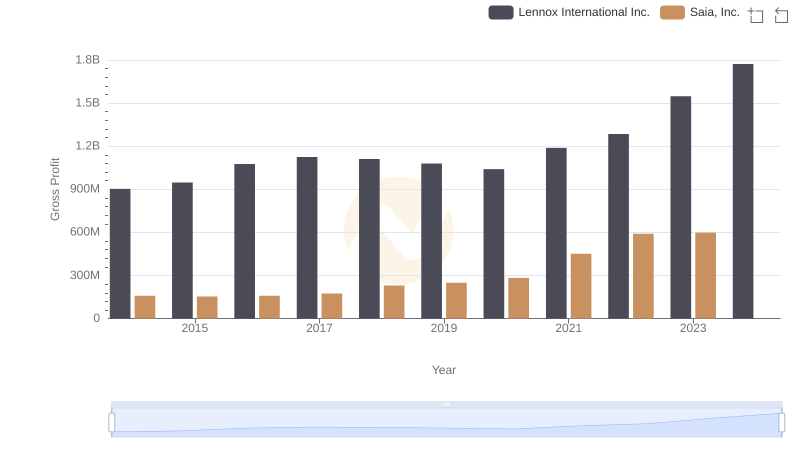
Gross Profit Trends Compared: Lennox International Inc. vs Saia, Inc.
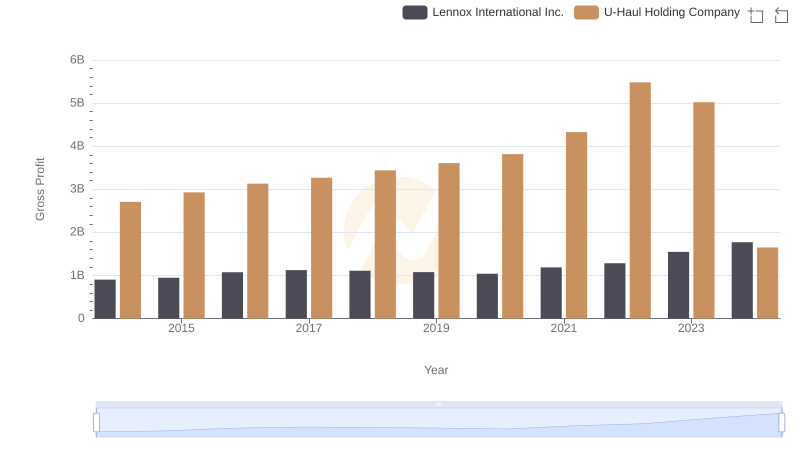
Lennox International Inc. vs U-Haul Holding Company: A Gross Profit Performance Breakdown
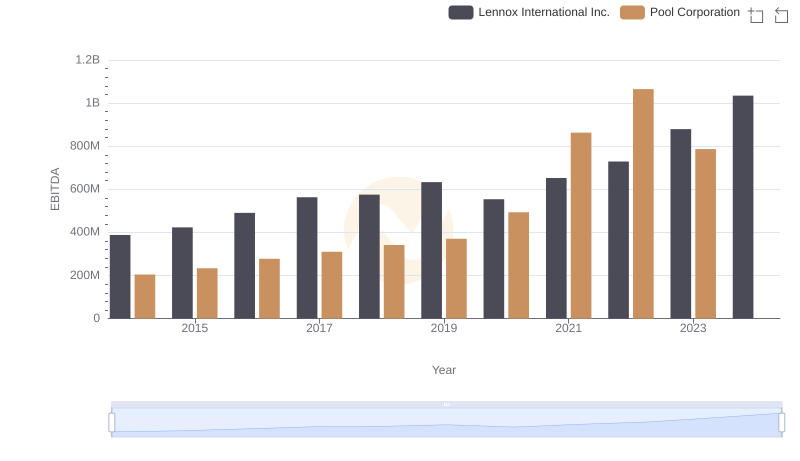
EBITDA Analysis: Evaluating Lennox International Inc. Against Pool Corporation