| __timestamp | Lennox International Inc. | Pool Corporation |
|---|---|---|
| Wednesday, January 1, 2014 | 3367400000 | 2246562000 |
| Thursday, January 1, 2015 | 3467400000 | 2363139000 |
| Friday, January 1, 2016 | 3641600000 | 2570803000 |
| Sunday, January 1, 2017 | 3839600000 | 2788188000 |
| Monday, January 1, 2018 | 3883900000 | 2998097000 |
| Tuesday, January 1, 2019 | 3807200000 | 3199517000 |
| Wednesday, January 1, 2020 | 3634100000 | 3936623000 |
| Friday, January 1, 2021 | 4194100000 | 5295584000 |
| Saturday, January 1, 2022 | 4718400000 | 6179727000 |
| Sunday, January 1, 2023 | 4981900000 | 5541595000 |
| Monday, January 1, 2024 | 5341300000 |
Unveiling the hidden dimensions of data
In the ever-evolving landscape of industrial and consumer goods, Lennox International Inc. and Pool Corporation have emerged as formidable players. Over the past decade, Lennox has seen its revenue grow by approximately 59%, from $3.37 billion in 2014 to an impressive $5.34 billion in 2024. Meanwhile, Pool Corporation has experienced a remarkable 145% increase, peaking at $6.18 billion in 2022 before a slight dip in 2023.
This growth narrative highlights the resilience and adaptability of these companies in a competitive market. Lennox's steady climb reflects its robust strategies in the HVAC industry, while Pool Corporation's surge underscores its dominance in the pool supply sector. However, the absence of 2024 data for Pool Corporation leaves room for speculation on its future trajectory. As these giants continue to innovate, their revenue trends offer valuable insights into their market strategies and consumer demand.
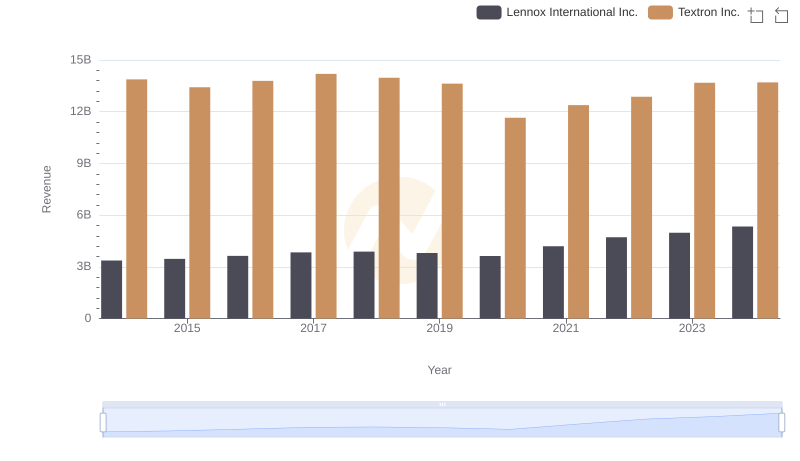
Lennox International Inc. vs Textron Inc.: Annual Revenue Growth Compared
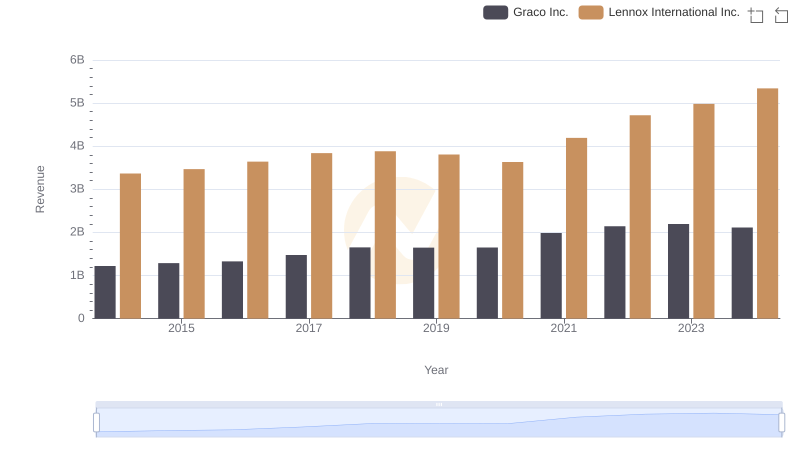
Revenue Showdown: Lennox International Inc. vs Graco Inc.
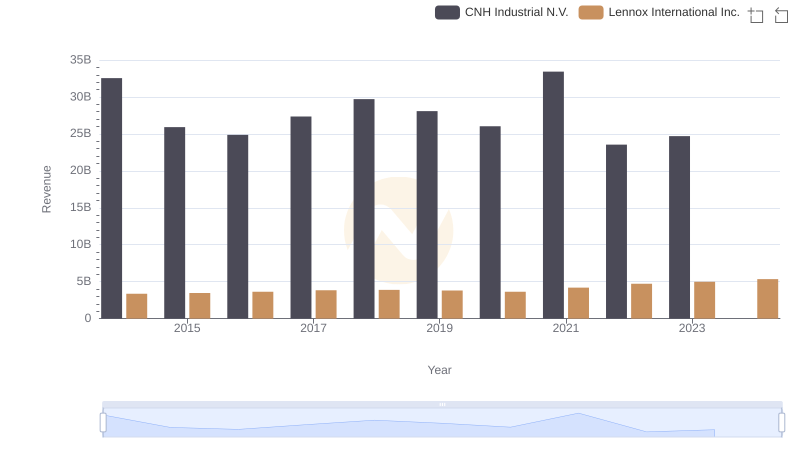
Lennox International Inc. and CNH Industrial N.V.: A Comprehensive Revenue Analysis
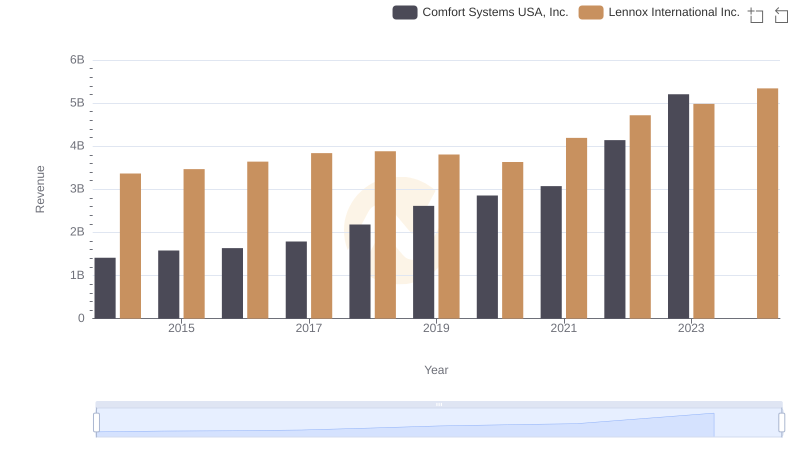
Lennox International Inc. vs Comfort Systems USA, Inc.: Annual Revenue Growth Compared
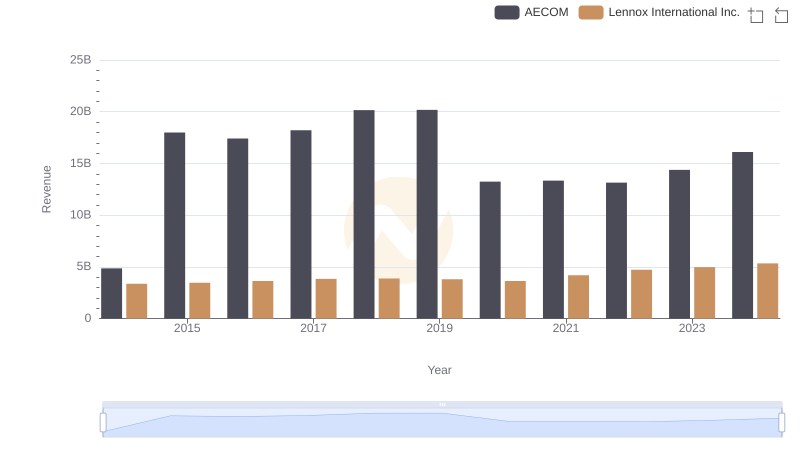
Lennox International Inc. vs AECOM: Examining Key Revenue Metrics
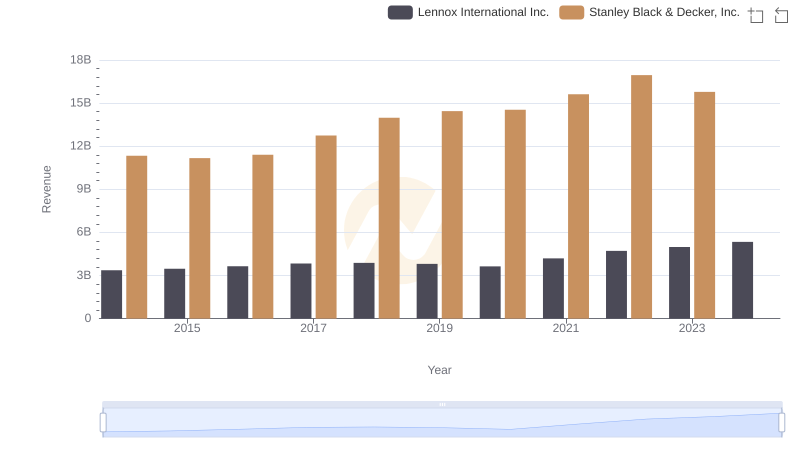
Lennox International Inc. and Stanley Black & Decker, Inc.: A Comprehensive Revenue Analysis
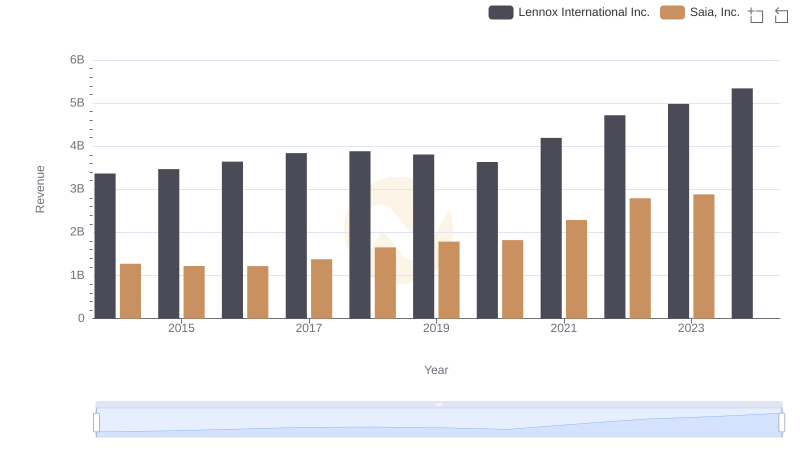
Revenue Insights: Lennox International Inc. and Saia, Inc. Performance Compared
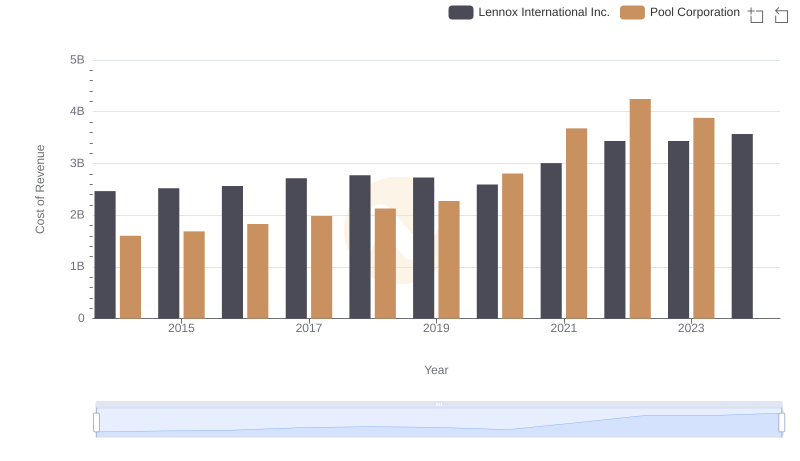
Comparing Cost of Revenue Efficiency: Lennox International Inc. vs Pool Corporation
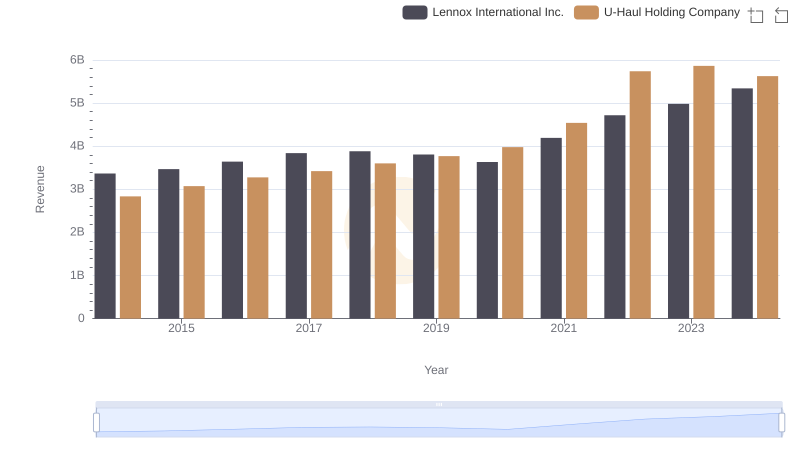
Lennox International Inc. and U-Haul Holding Company: A Comprehensive Revenue Analysis
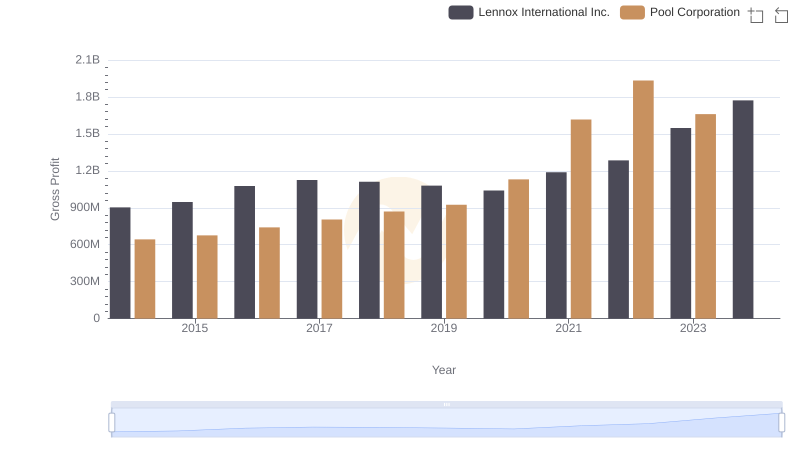
Key Insights on Gross Profit: Lennox International Inc. vs Pool Corporation
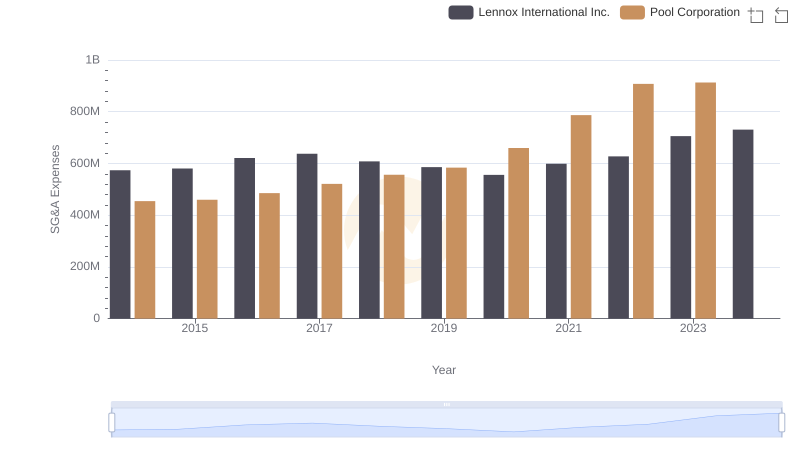
Selling, General, and Administrative Costs: Lennox International Inc. vs Pool Corporation
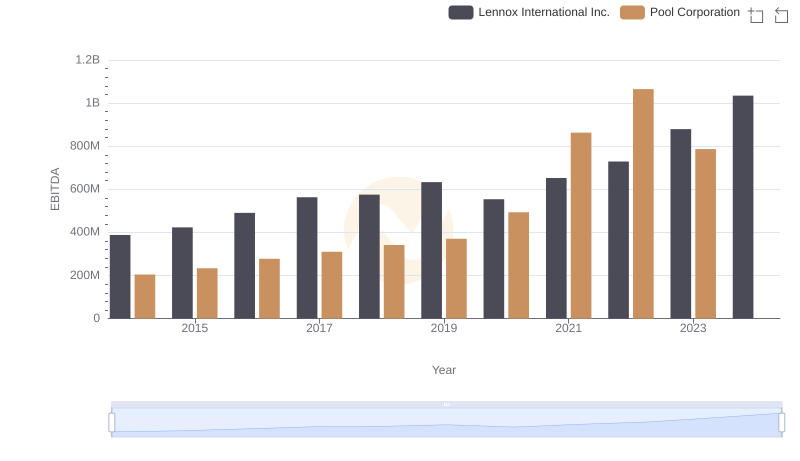
EBITDA Analysis: Evaluating Lennox International Inc. Against Pool Corporation