| __timestamp | Comfort Systems USA, Inc. | Lennox International Inc. |
|---|---|---|
| Wednesday, January 1, 2014 | 1161024000 | 2464100000 |
| Thursday, January 1, 2015 | 1262390000 | 2520000000 |
| Friday, January 1, 2016 | 1290331000 | 2565100000 |
| Sunday, January 1, 2017 | 1421641000 | 2714400000 |
| Monday, January 1, 2018 | 1736600000 | 2772700000 |
| Tuesday, January 1, 2019 | 2113334000 | 2727400000 |
| Wednesday, January 1, 2020 | 2309676000 | 2594000000 |
| Friday, January 1, 2021 | 2510429000 | 3005700000 |
| Saturday, January 1, 2022 | 3398756000 | 3433700000 |
| Sunday, January 1, 2023 | 4216251000 | 3434100000 |
| Monday, January 1, 2024 | 3569400000 |
Unlocking the unknown
In the ever-evolving landscape of the HVAC industry, understanding cost dynamics is crucial. From 2014 to 2023, Lennox International Inc. and Comfort Systems USA, Inc. have shown distinct trends in their cost of revenue. Lennox International's cost of revenue has seen a steady increase, peaking at approximately $3.43 billion in 2023, marking a 39% rise from 2014. Meanwhile, Comfort Systems USA, Inc. experienced a more dramatic surge, with costs soaring by 263% over the same period, reaching $4.22 billion in 2023. This stark contrast highlights differing operational strategies and market responses. Notably, 2024 data for Comfort Systems is missing, leaving room for speculation on future trends. As these companies navigate economic shifts, their cost management strategies will be pivotal in maintaining competitive advantage.
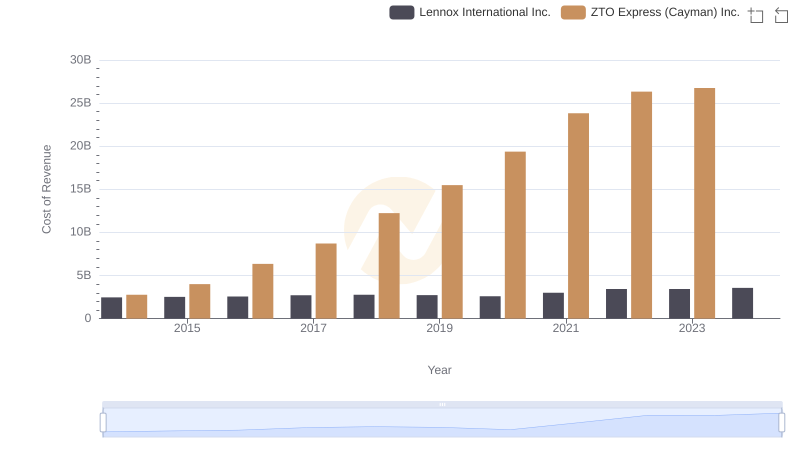
Lennox International Inc. vs ZTO Express (Cayman) Inc.: Efficiency in Cost of Revenue Explored
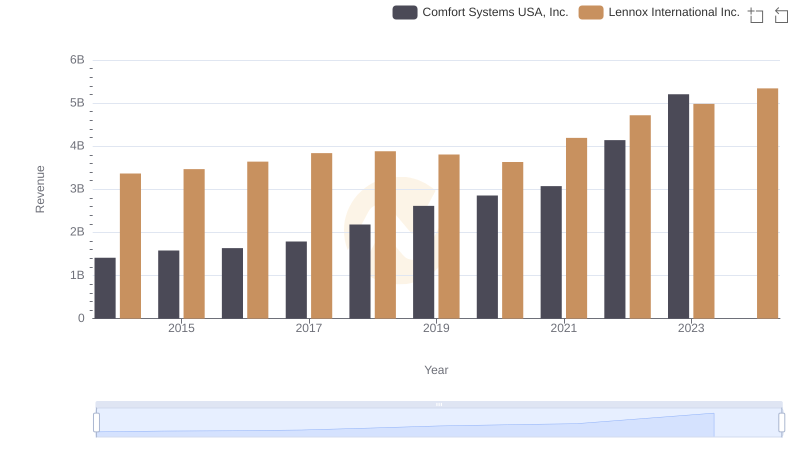
Lennox International Inc. vs Comfort Systems USA, Inc.: Annual Revenue Growth Compared
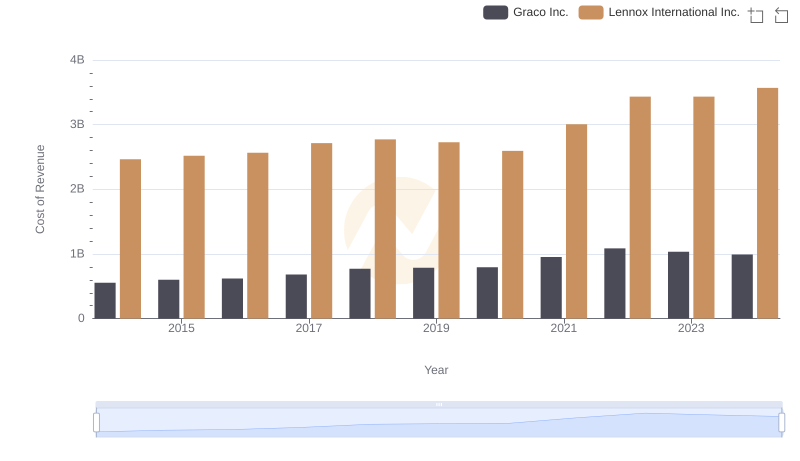
Cost of Revenue Comparison: Lennox International Inc. vs Graco Inc.
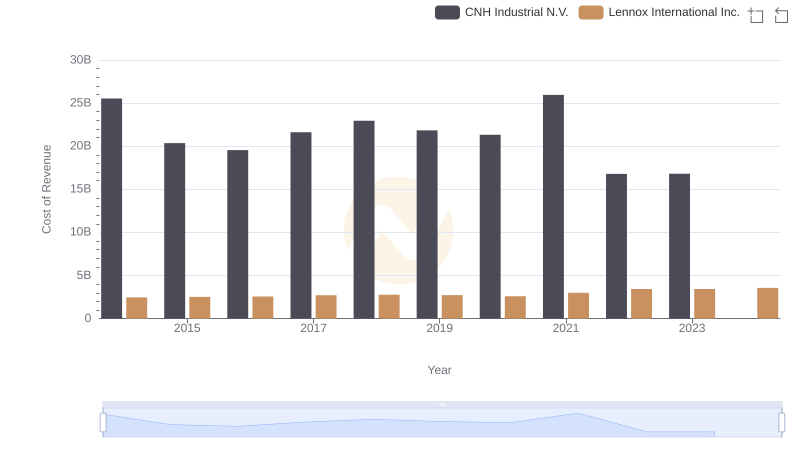
Cost of Revenue Trends: Lennox International Inc. vs CNH Industrial N.V.
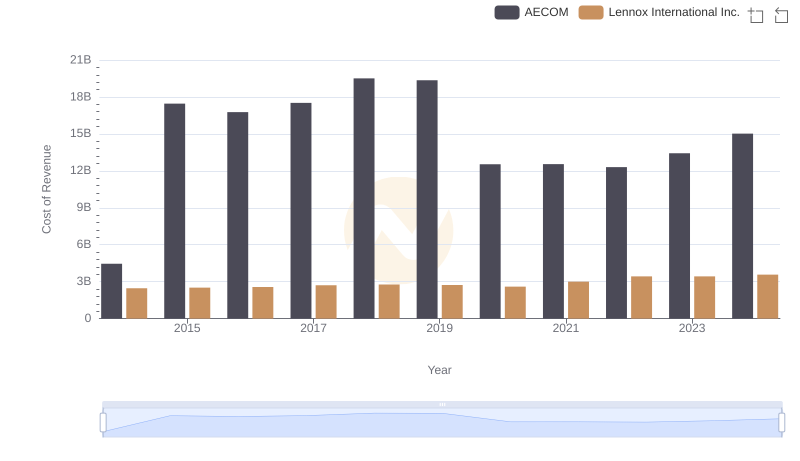
Cost of Revenue Trends: Lennox International Inc. vs AECOM
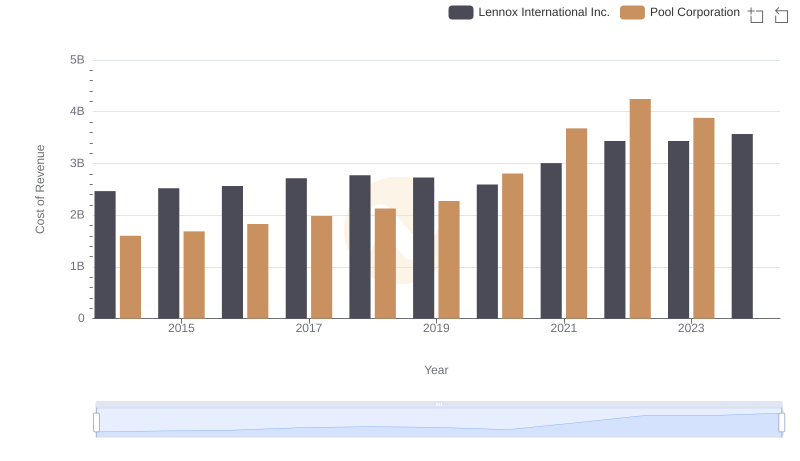
Comparing Cost of Revenue Efficiency: Lennox International Inc. vs Pool Corporation
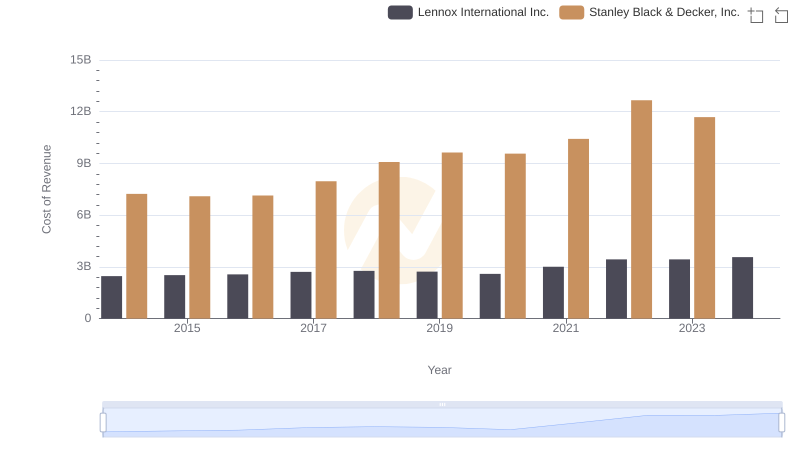
Analyzing Cost of Revenue: Lennox International Inc. and Stanley Black & Decker, Inc.
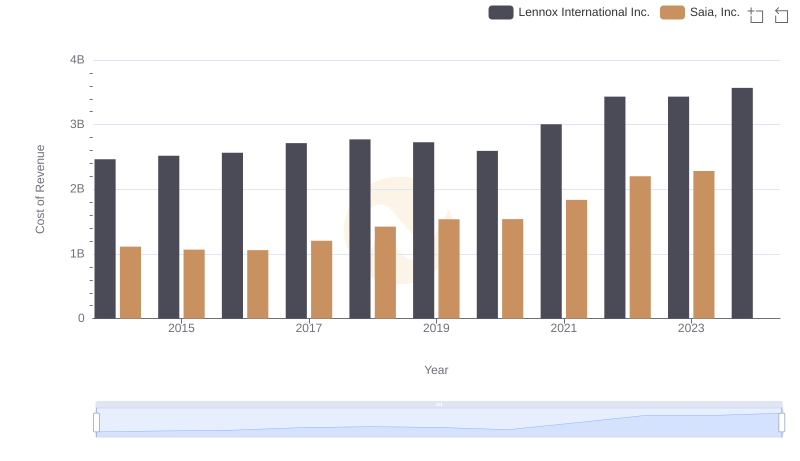
Cost Insights: Breaking Down Lennox International Inc. and Saia, Inc.'s Expenses
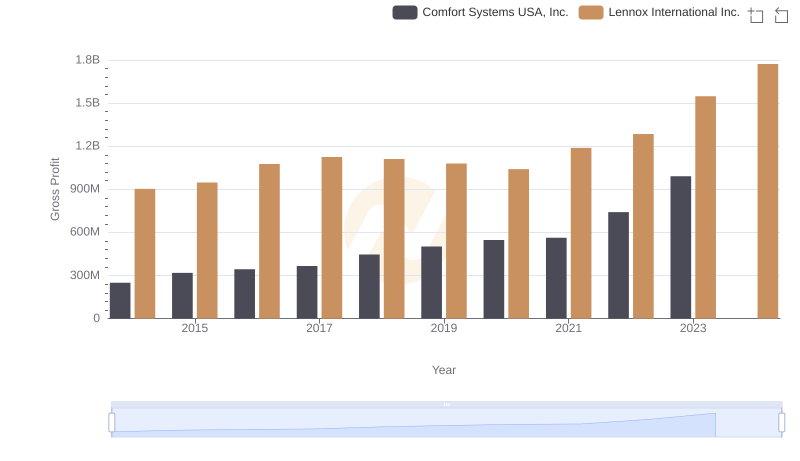
Lennox International Inc. and Comfort Systems USA, Inc.: A Detailed Gross Profit Analysis
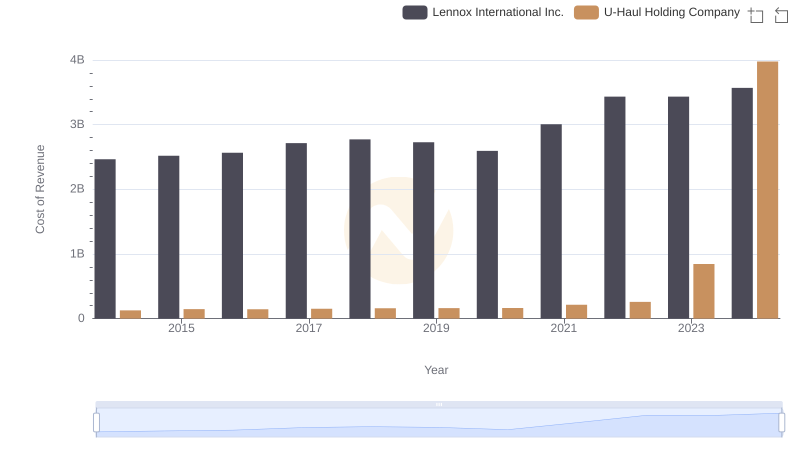
Cost Insights: Breaking Down Lennox International Inc. and U-Haul Holding Company's Expenses
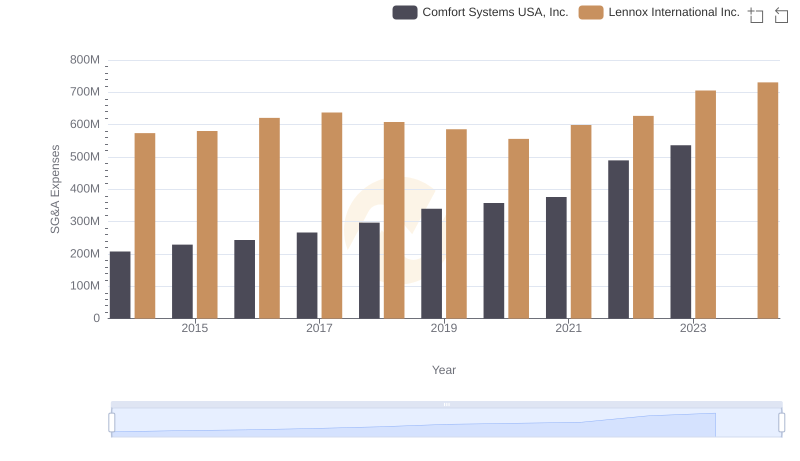
Selling, General, and Administrative Costs: Lennox International Inc. vs Comfort Systems USA, Inc.
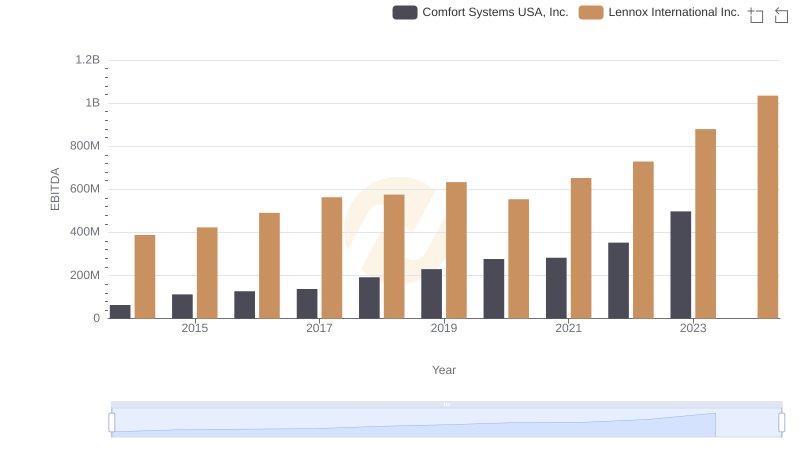
A Professional Review of EBITDA: Lennox International Inc. Compared to Comfort Systems USA, Inc.