| __timestamp | Comfort Systems USA, Inc. | Lennox International Inc. |
|---|---|---|
| Wednesday, January 1, 2014 | 63455000 | 387700000 |
| Thursday, January 1, 2015 | 112580000 | 423600000 |
| Friday, January 1, 2016 | 126974000 | 490800000 |
| Sunday, January 1, 2017 | 137151000 | 562900000 |
| Monday, January 1, 2018 | 191982000 | 575200000 |
| Tuesday, January 1, 2019 | 229518000 | 633300000 |
| Wednesday, January 1, 2020 | 276904000 | 553900000 |
| Friday, January 1, 2021 | 282506000 | 652500000 |
| Saturday, January 1, 2022 | 352446000 | 729000000 |
| Sunday, January 1, 2023 | 497652000 | 879500000 |
| Monday, January 1, 2024 | 1034800000 |
Unleashing the power of data
In the ever-evolving landscape of the HVAC industry, Lennox International Inc. and Comfort Systems USA, Inc. have emerged as key players. Over the past decade, Lennox International has consistently outperformed Comfort Systems in terms of EBITDA, showcasing a robust growth trajectory. From 2014 to 2023, Lennox's EBITDA surged by approximately 127%, reaching a peak of $879 million in 2023. In contrast, Comfort Systems demonstrated a remarkable growth of 684% during the same period, albeit starting from a lower base, culminating in an EBITDA of $498 million in 2023.
This data highlights the dynamic nature of the industry, with both companies capitalizing on market opportunities. However, Lennox's consistent upward trend suggests a more stable growth pattern, while Comfort Systems' rapid rise indicates aggressive expansion strategies. As we look to the future, the missing data for 2024 leaves room for speculation on how these industry giants will continue to evolve.
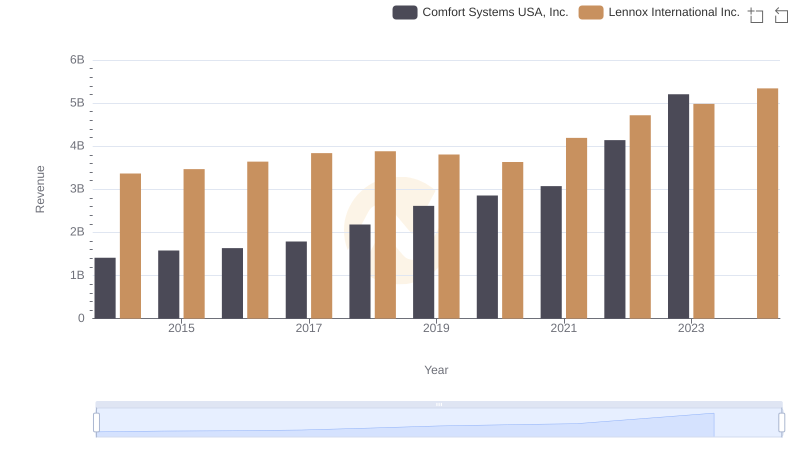
Lennox International Inc. vs Comfort Systems USA, Inc.: Annual Revenue Growth Compared
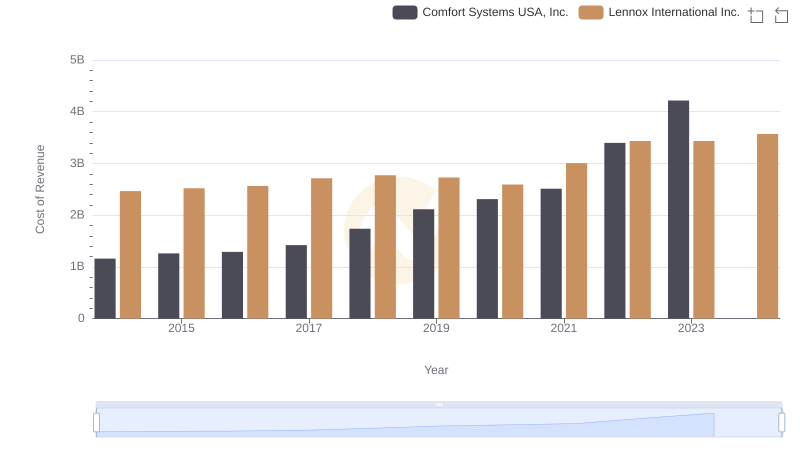
Cost of Revenue Trends: Lennox International Inc. vs Comfort Systems USA, Inc.
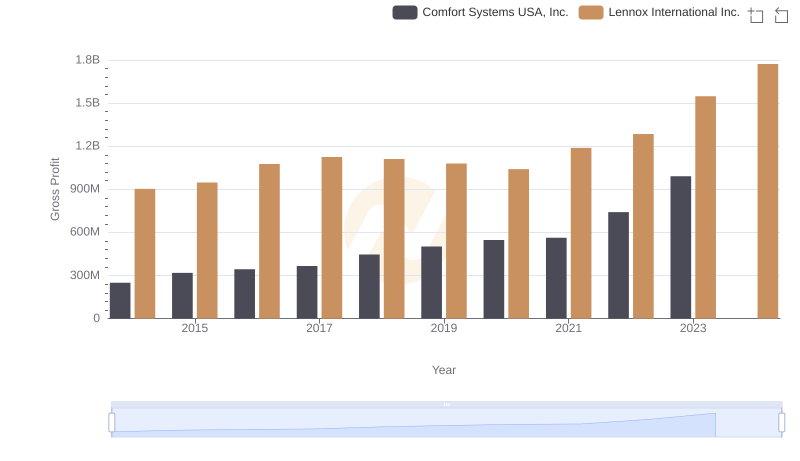
Lennox International Inc. and Comfort Systems USA, Inc.: A Detailed Gross Profit Analysis
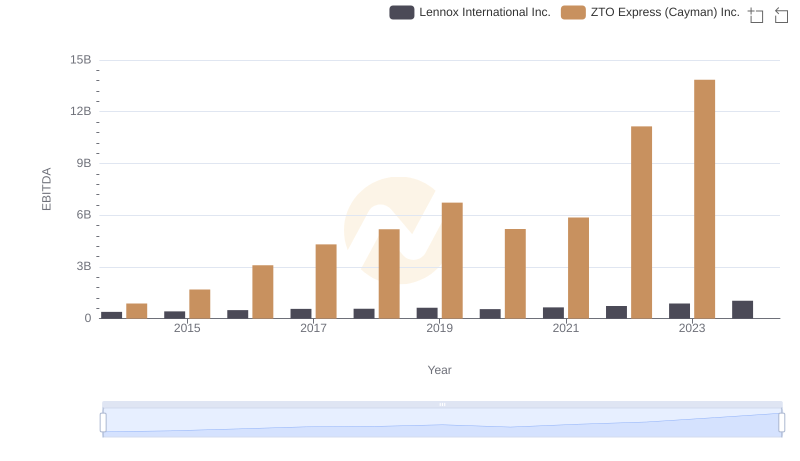
A Professional Review of EBITDA: Lennox International Inc. Compared to ZTO Express (Cayman) Inc.
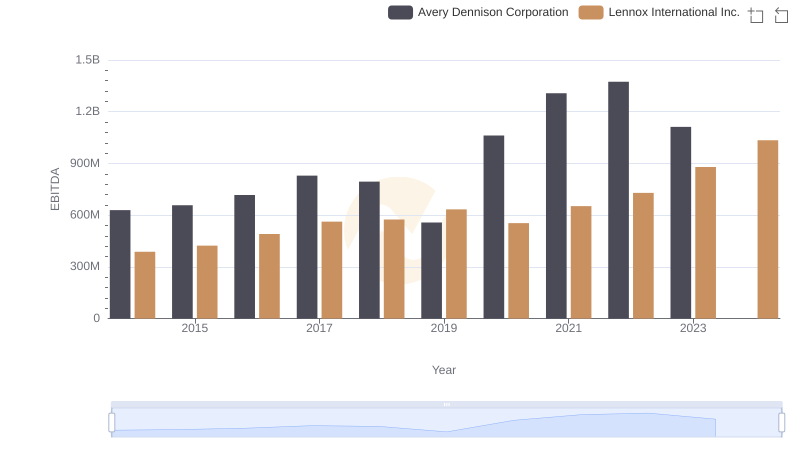
A Professional Review of EBITDA: Lennox International Inc. Compared to Avery Dennison Corporation
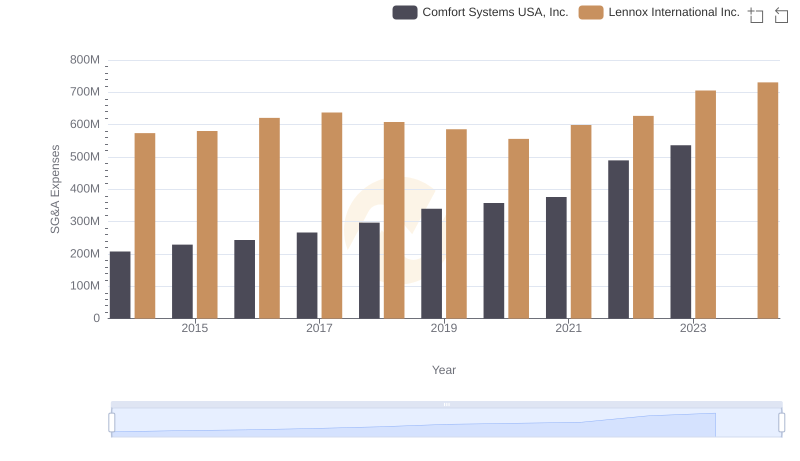
Selling, General, and Administrative Costs: Lennox International Inc. vs Comfort Systems USA, Inc.
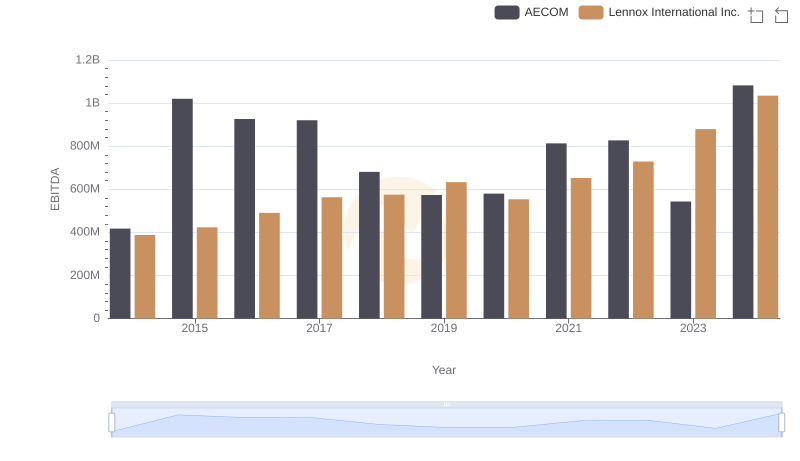
EBITDA Analysis: Evaluating Lennox International Inc. Against AECOM
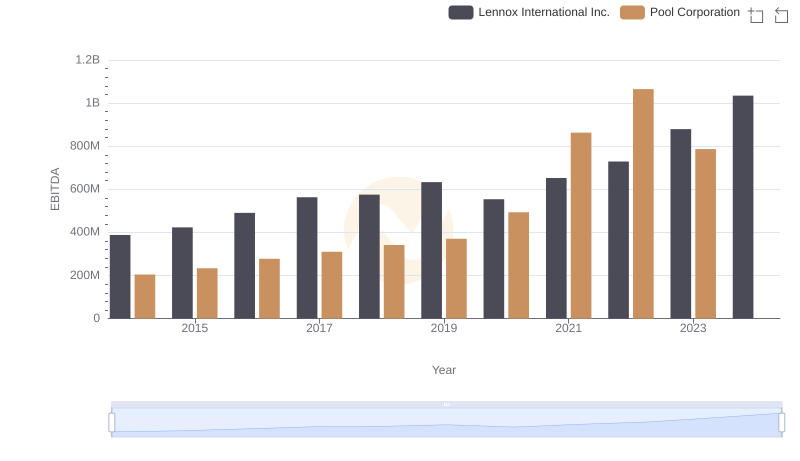
EBITDA Analysis: Evaluating Lennox International Inc. Against Pool Corporation
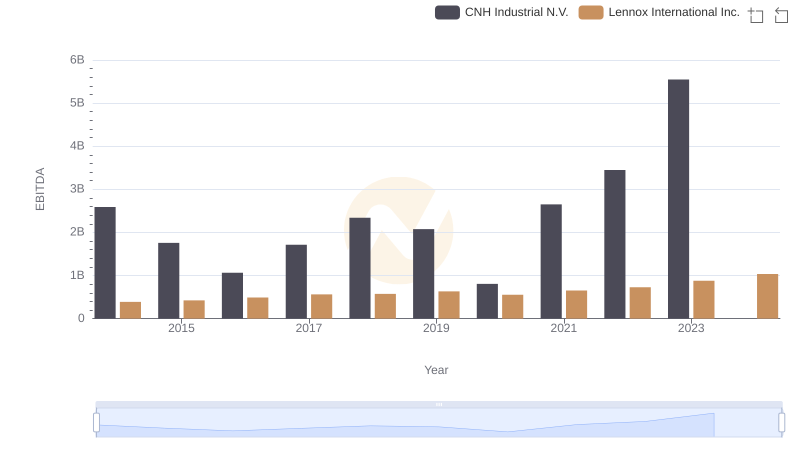
Comprehensive EBITDA Comparison: Lennox International Inc. vs CNH Industrial N.V.
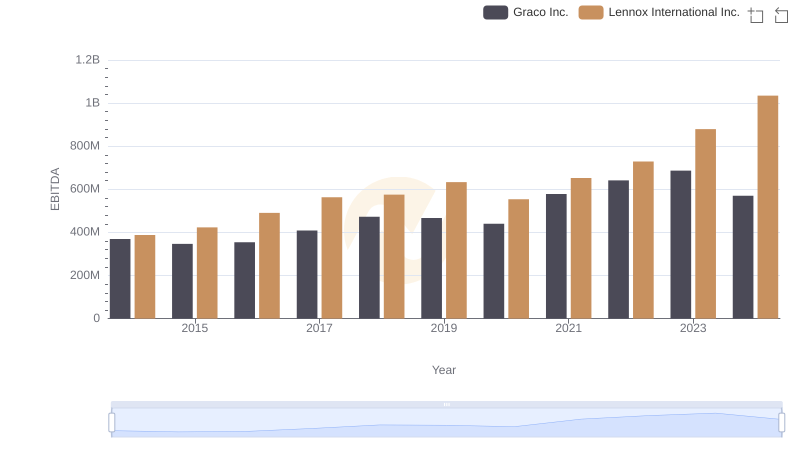
Comparative EBITDA Analysis: Lennox International Inc. vs Graco Inc.

Professional EBITDA Benchmarking: Lennox International Inc. vs Stanley Black & Decker, Inc.
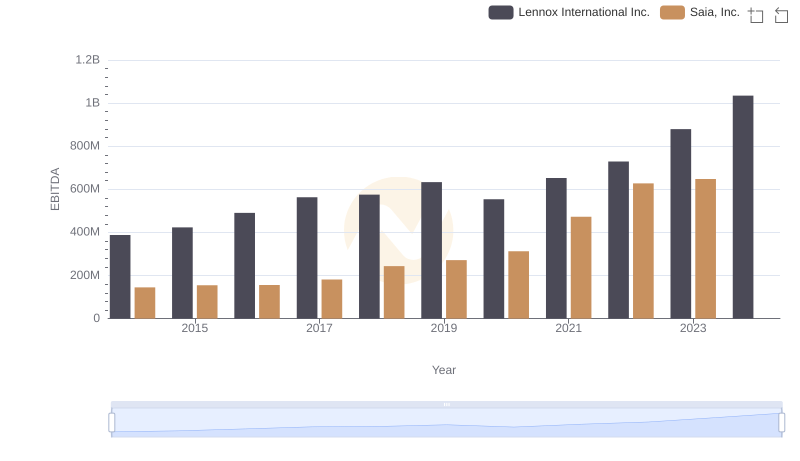
Comprehensive EBITDA Comparison: Lennox International Inc. vs Saia, Inc.