| __timestamp | Comfort Systems USA, Inc. | Lennox International Inc. |
|---|---|---|
| Wednesday, January 1, 2014 | 249771000 | 903300000 |
| Thursday, January 1, 2015 | 318129000 | 947400000 |
| Friday, January 1, 2016 | 344009000 | 1076500000 |
| Sunday, January 1, 2017 | 366281000 | 1125200000 |
| Monday, January 1, 2018 | 446279000 | 1111200000 |
| Tuesday, January 1, 2019 | 501943000 | 1079800000 |
| Wednesday, January 1, 2020 | 546983000 | 1040100000 |
| Friday, January 1, 2021 | 563207000 | 1188400000 |
| Saturday, January 1, 2022 | 741608000 | 1284700000 |
| Sunday, January 1, 2023 | 990509000 | 1547800000 |
| Monday, January 1, 2024 | 1771900000 |
Data in motion
In the ever-evolving HVAC industry, Lennox International Inc. and Comfort Systems USA, Inc. have emerged as key players. Over the past decade, Lennox International has consistently outperformed Comfort Systems in terms of gross profit. From 2014 to 2023, Lennox's gross profit surged by approximately 71%, peaking at $1.55 billion in 2023. In contrast, Comfort Systems saw a remarkable 297% increase, reaching nearly $991 million in the same year. This growth trajectory highlights Comfort Systems' aggressive expansion strategy, despite Lennox's larger market share.
The data reveals a consistent upward trend for both companies, with Lennox maintaining a steady lead. However, the absence of data for Comfort Systems in 2024 suggests potential challenges or reporting delays. As the HVAC market continues to grow, these companies' financial performances will be crucial indicators of industry health and innovation.
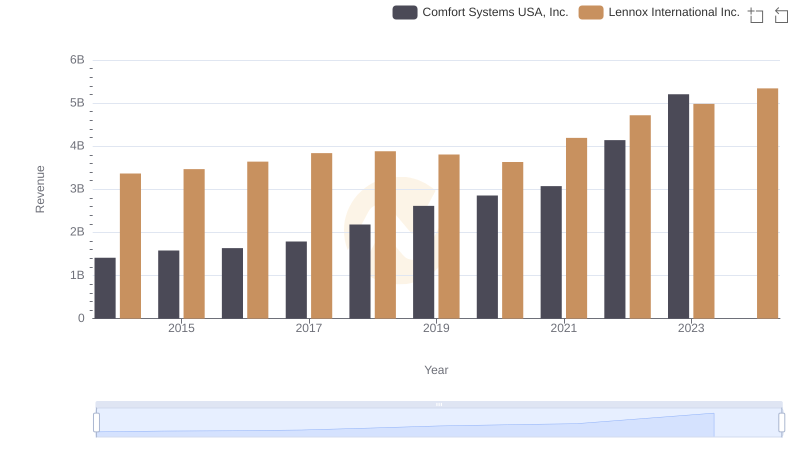
Lennox International Inc. vs Comfort Systems USA, Inc.: Annual Revenue Growth Compared
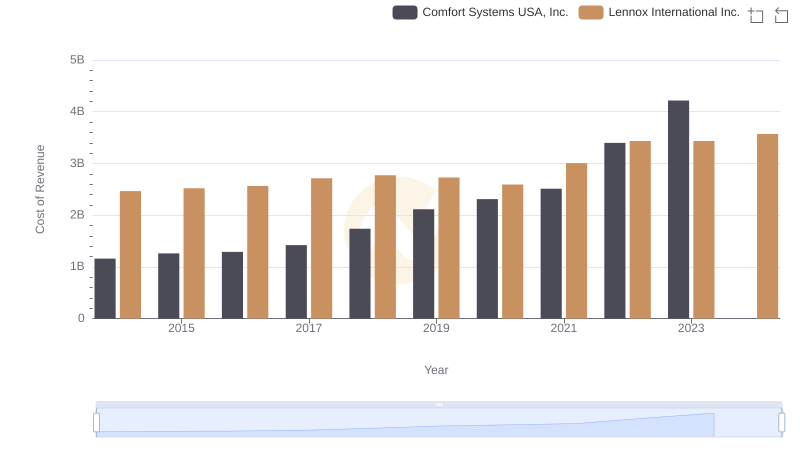
Cost of Revenue Trends: Lennox International Inc. vs Comfort Systems USA, Inc.
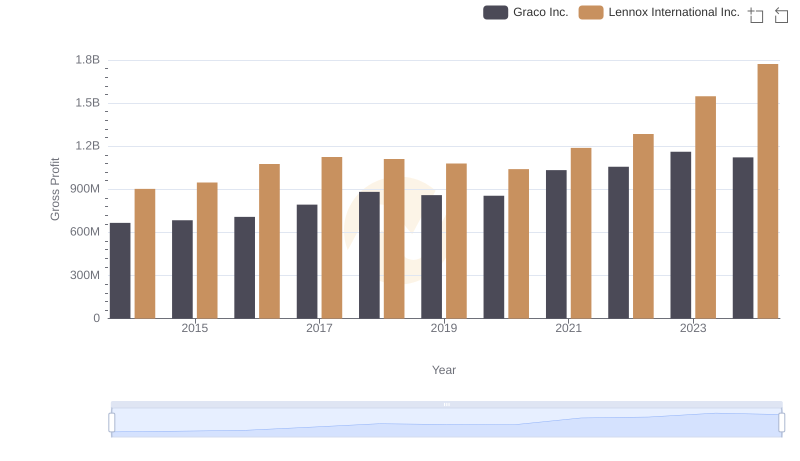
Lennox International Inc. and Graco Inc.: A Detailed Gross Profit Analysis
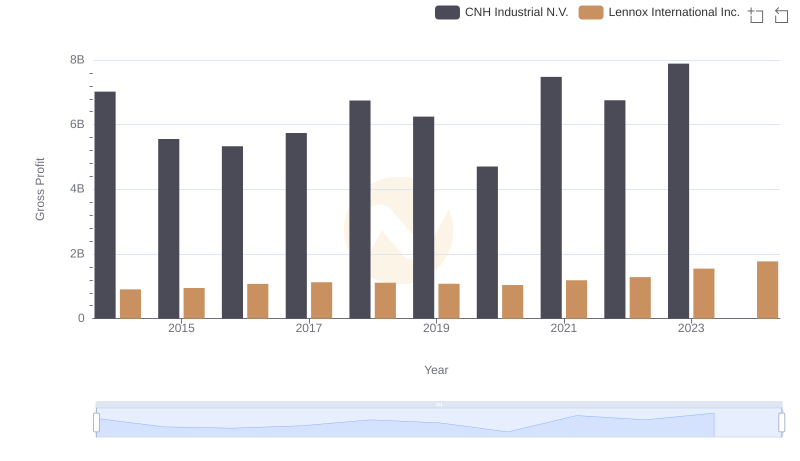
Lennox International Inc. and CNH Industrial N.V.: A Detailed Gross Profit Analysis
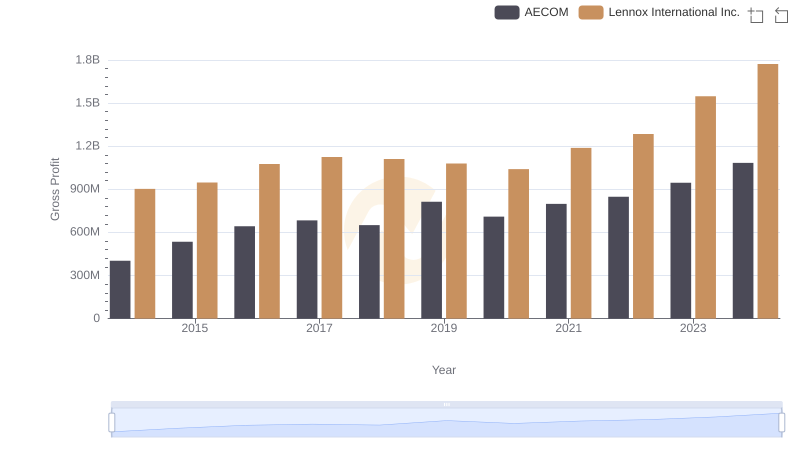
Lennox International Inc. vs AECOM: A Gross Profit Performance Breakdown
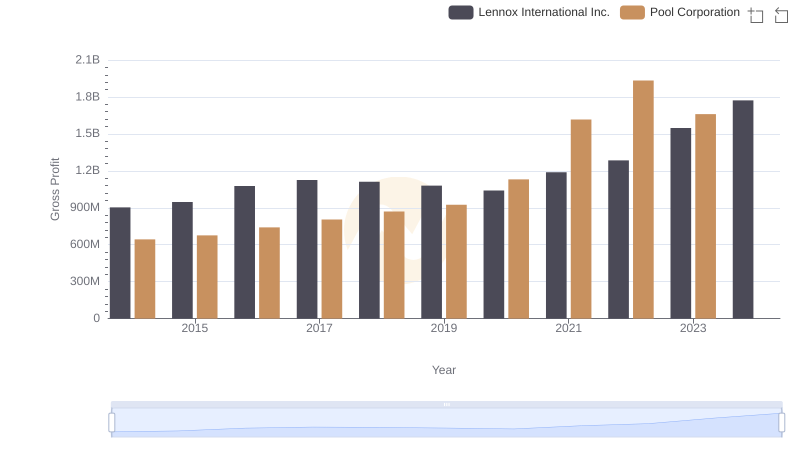
Key Insights on Gross Profit: Lennox International Inc. vs Pool Corporation
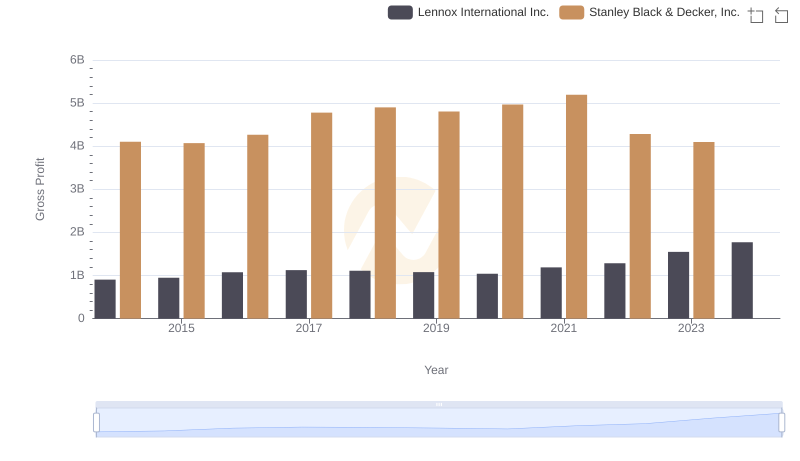
Lennox International Inc. vs Stanley Black & Decker, Inc.: A Gross Profit Performance Breakdown
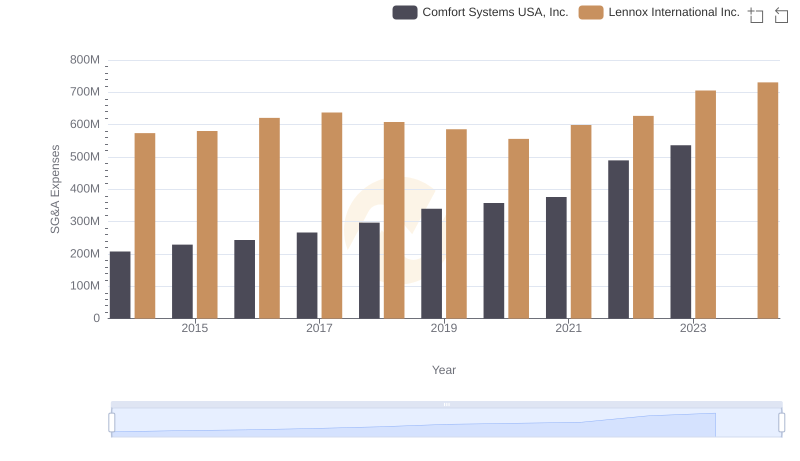
Selling, General, and Administrative Costs: Lennox International Inc. vs Comfort Systems USA, Inc.
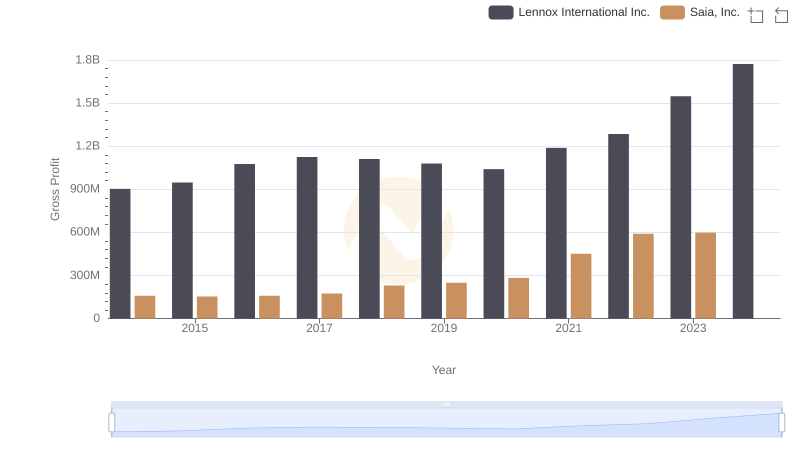
Gross Profit Trends Compared: Lennox International Inc. vs Saia, Inc.
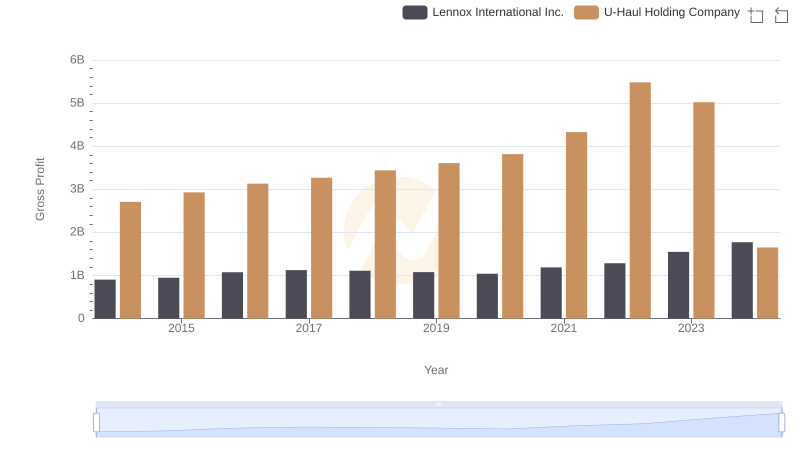
Lennox International Inc. vs U-Haul Holding Company: A Gross Profit Performance Breakdown
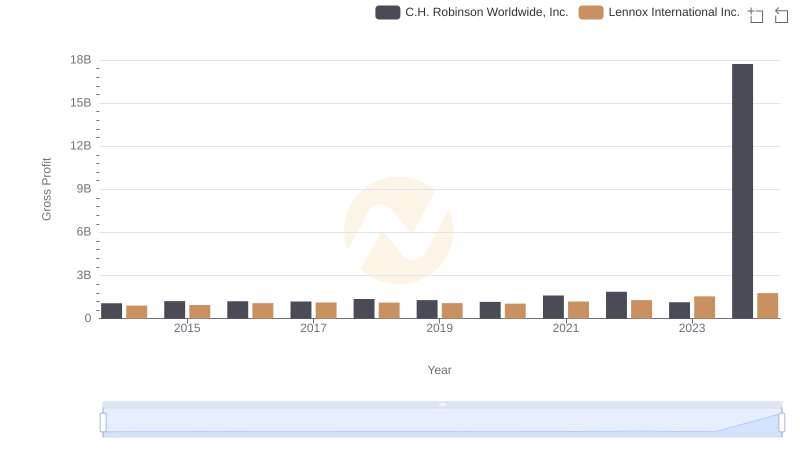
Gross Profit Analysis: Comparing Lennox International Inc. and C.H. Robinson Worldwide, Inc.
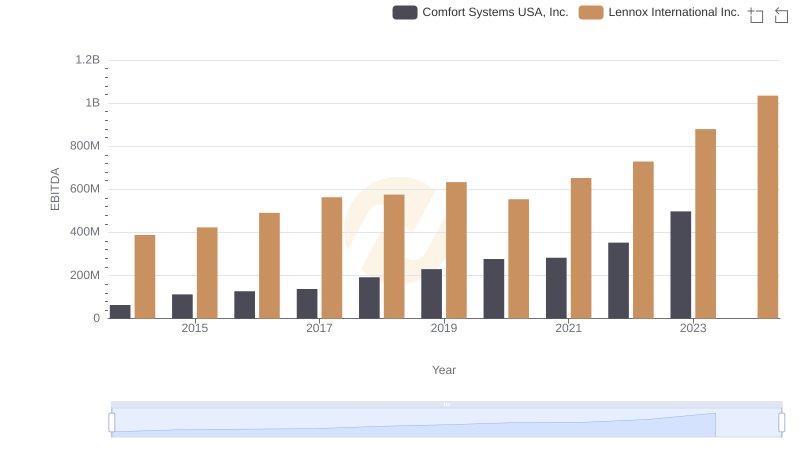
A Professional Review of EBITDA: Lennox International Inc. Compared to Comfort Systems USA, Inc.