| __timestamp | Comfort Systems USA, Inc. | Lennox International Inc. |
|---|---|---|
| Wednesday, January 1, 2014 | 1410795000 | 3367400000 |
| Thursday, January 1, 2015 | 1580519000 | 3467400000 |
| Friday, January 1, 2016 | 1634340000 | 3641600000 |
| Sunday, January 1, 2017 | 1787922000 | 3839600000 |
| Monday, January 1, 2018 | 2182879000 | 3883900000 |
| Tuesday, January 1, 2019 | 2615277000 | 3807200000 |
| Wednesday, January 1, 2020 | 2856659000 | 3634100000 |
| Friday, January 1, 2021 | 3073636000 | 4194100000 |
| Saturday, January 1, 2022 | 4140364000 | 4718400000 |
| Sunday, January 1, 2023 | 5206760000 | 4981900000 |
| Monday, January 1, 2024 | 5341300000 |
Data in motion
In the competitive world of HVAC systems, Lennox International Inc. and Comfort Systems USA, Inc. have been key players. Over the past decade, these companies have shown remarkable revenue growth, reflecting their strategic market positioning and operational efficiency.
From 2014 to 2023, Comfort Systems USA, Inc. experienced a staggering 269% increase in revenue, starting from approximately $1.4 billion and reaching over $5.2 billion. This growth underscores their expanding footprint in the HVAC industry, driven by a robust demand for energy-efficient solutions.
Meanwhile, Lennox International Inc. saw a steady rise of about 48% in revenue, from $3.4 billion to nearly $5 billion by 2023. Despite a slight dip in 2019 and 2020, Lennox rebounded strongly, showcasing resilience and adaptability in a fluctuating market.
While 2024 data for Comfort Systems is missing, Lennox's continued growth trajectory suggests a promising future for both companies.
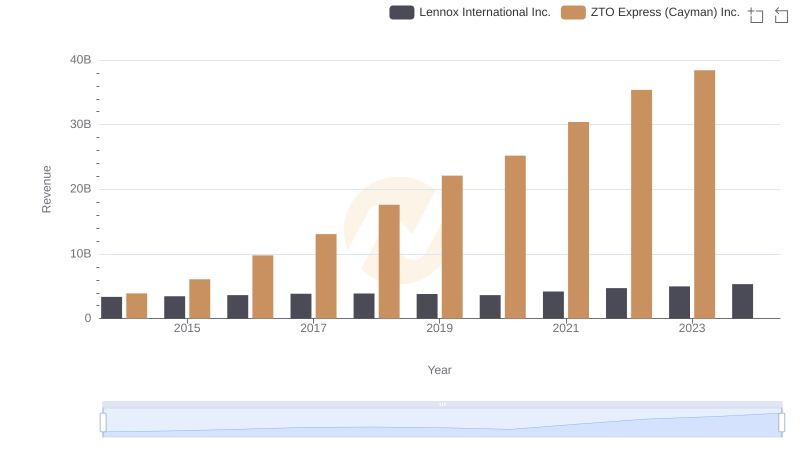
Lennox International Inc. and ZTO Express (Cayman) Inc.: A Comprehensive Revenue Analysis
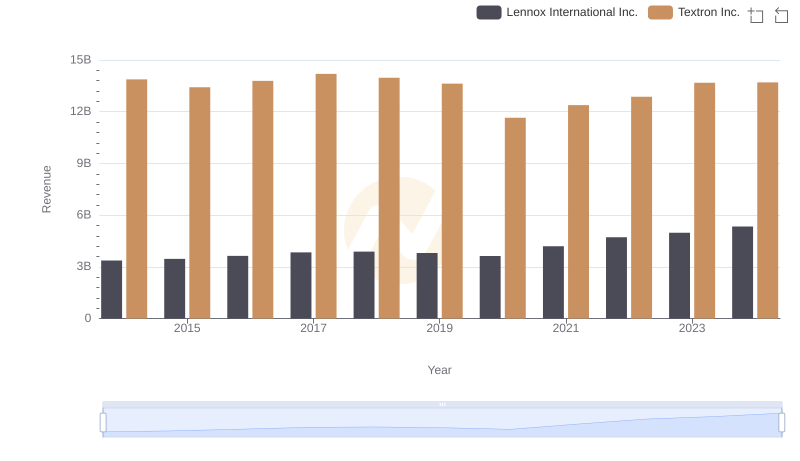
Lennox International Inc. vs Textron Inc.: Annual Revenue Growth Compared
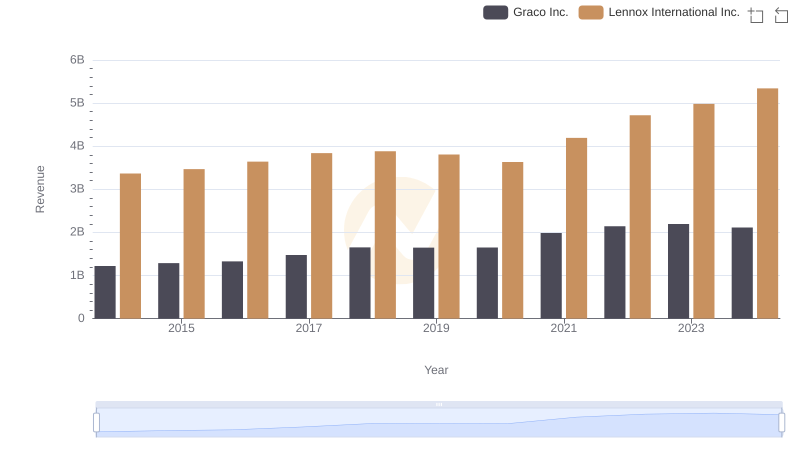
Revenue Showdown: Lennox International Inc. vs Graco Inc.
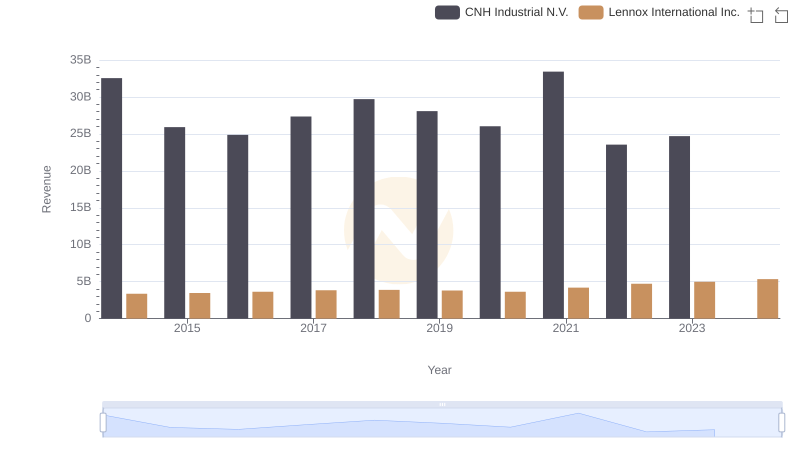
Lennox International Inc. and CNH Industrial N.V.: A Comprehensive Revenue Analysis
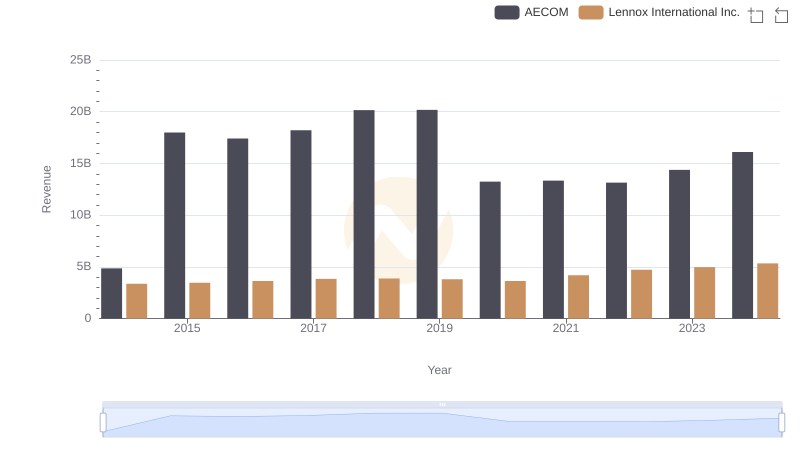
Lennox International Inc. vs AECOM: Examining Key Revenue Metrics
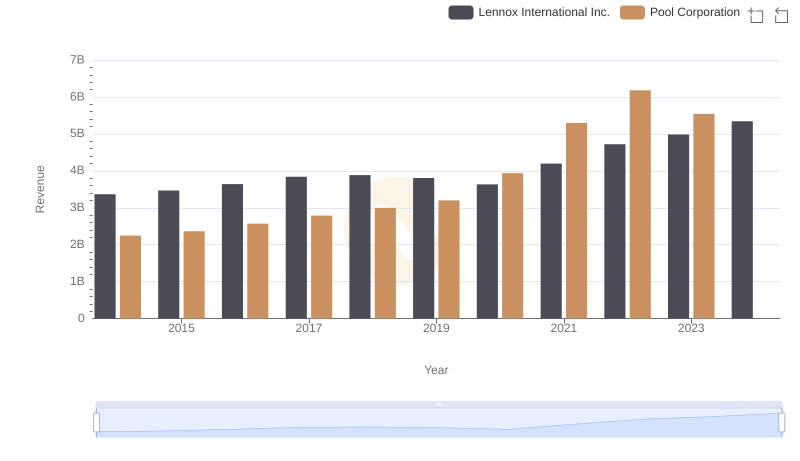
Lennox International Inc. vs Pool Corporation: Annual Revenue Growth Compared
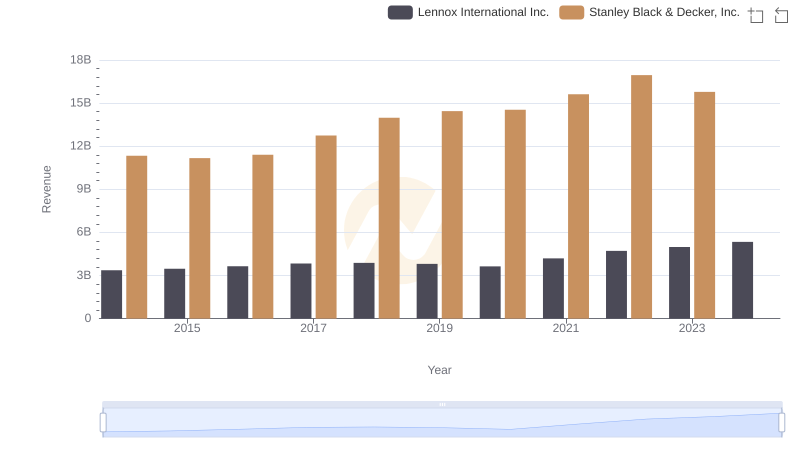
Lennox International Inc. and Stanley Black & Decker, Inc.: A Comprehensive Revenue Analysis
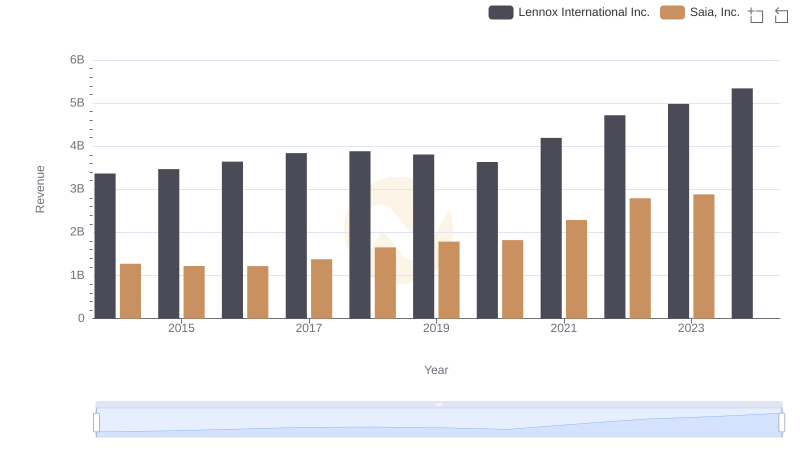
Revenue Insights: Lennox International Inc. and Saia, Inc. Performance Compared
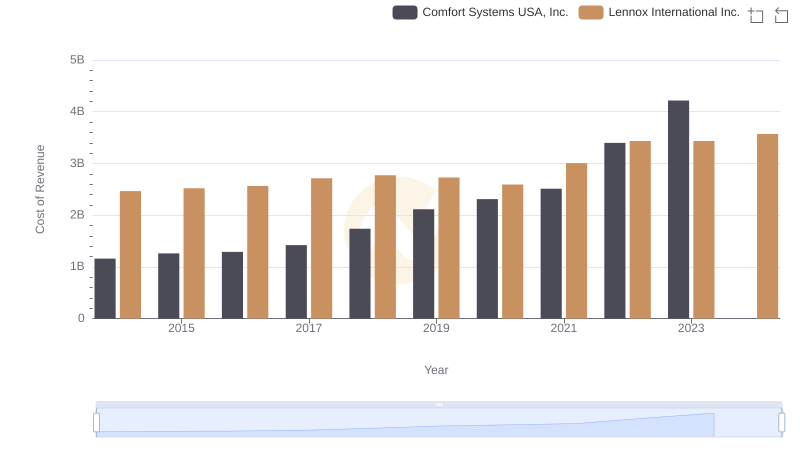
Cost of Revenue Trends: Lennox International Inc. vs Comfort Systems USA, Inc.
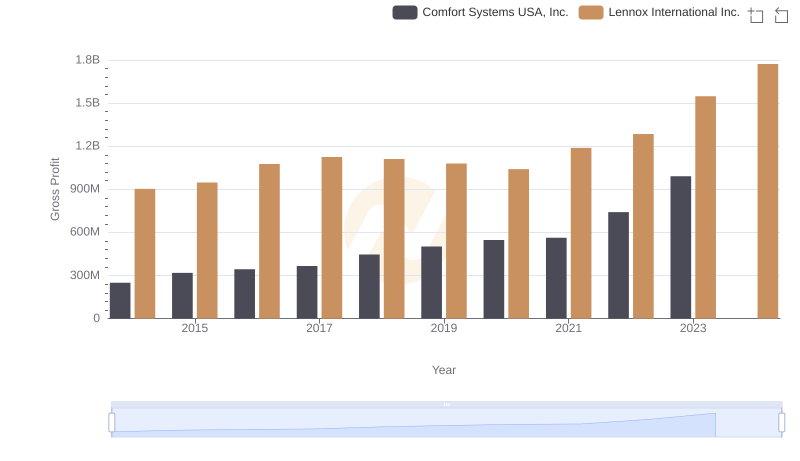
Lennox International Inc. and Comfort Systems USA, Inc.: A Detailed Gross Profit Analysis
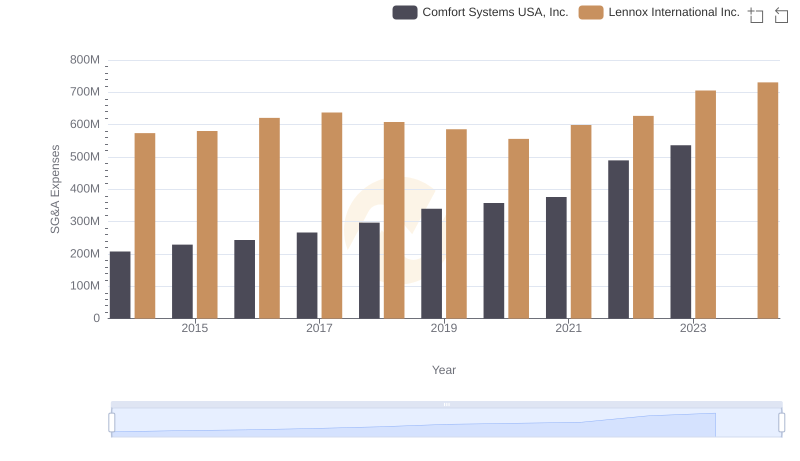
Selling, General, and Administrative Costs: Lennox International Inc. vs Comfort Systems USA, Inc.
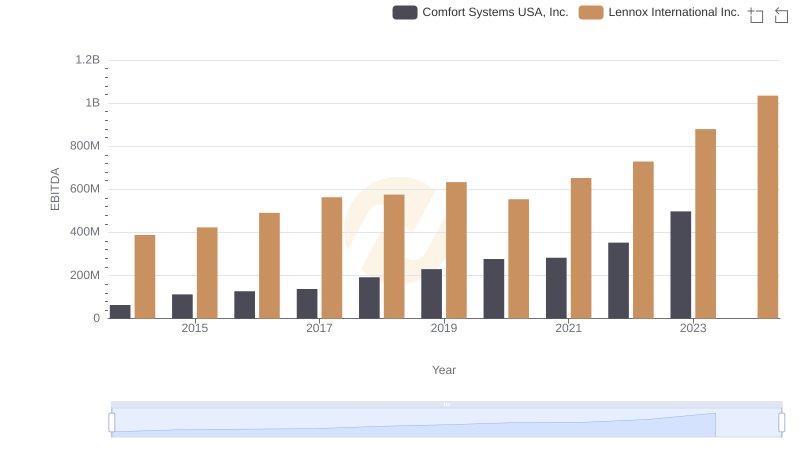
A Professional Review of EBITDA: Lennox International Inc. Compared to Comfort Systems USA, Inc.