| __timestamp | Corning Incorporated | Intuit Inc. |
|---|---|---|
| Wednesday, January 1, 2014 | 1211000000 | 1762000000 |
| Thursday, January 1, 2015 | 1523000000 | 1771000000 |
| Friday, January 1, 2016 | 1472000000 | 1807000000 |
| Sunday, January 1, 2017 | 1467000000 | 1973000000 |
| Monday, January 1, 2018 | 1799000000 | 2298000000 |
| Tuesday, January 1, 2019 | 1585000000 | 2524000000 |
| Wednesday, January 1, 2020 | 1747000000 | 2727000000 |
| Friday, January 1, 2021 | 1827000000 | 3626000000 |
| Saturday, January 1, 2022 | 1898000000 | 4986000000 |
| Sunday, January 1, 2023 | 1843000000 | 5062000000 |
| Monday, January 1, 2024 | 1931000000 | 5730000000 |
Data in motion
In the ever-evolving landscape of corporate America, understanding the financial health of industry leaders is crucial. This chart offers a fascinating glimpse into the Selling, General, and Administrative (SG&A) expenses of Intuit Inc. and Corning Incorporated from 2014 to 2023. Over this decade, Intuit's SG&A expenses have surged by approximately 187%, reflecting its aggressive growth strategy and expansion into new markets. In contrast, Corning's expenses have grown by about 52%, indicating a more stable, yet consistent, operational approach.
Explore these trends to understand how these giants navigate their financial landscapes.
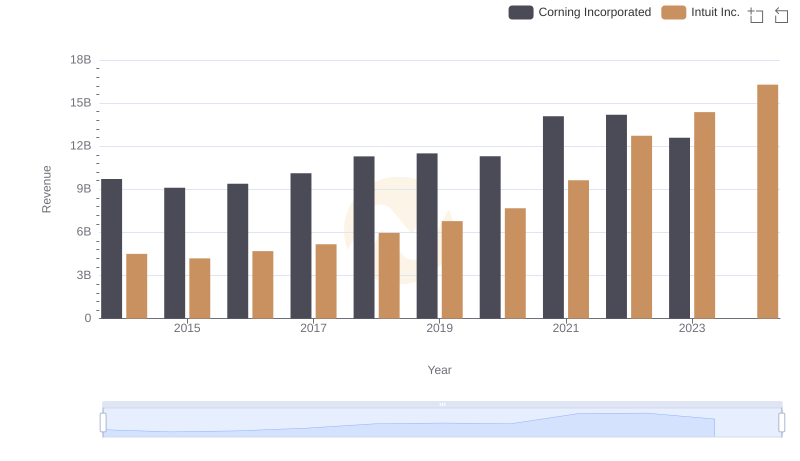
Intuit Inc. vs Corning Incorporated: Examining Key Revenue Metrics
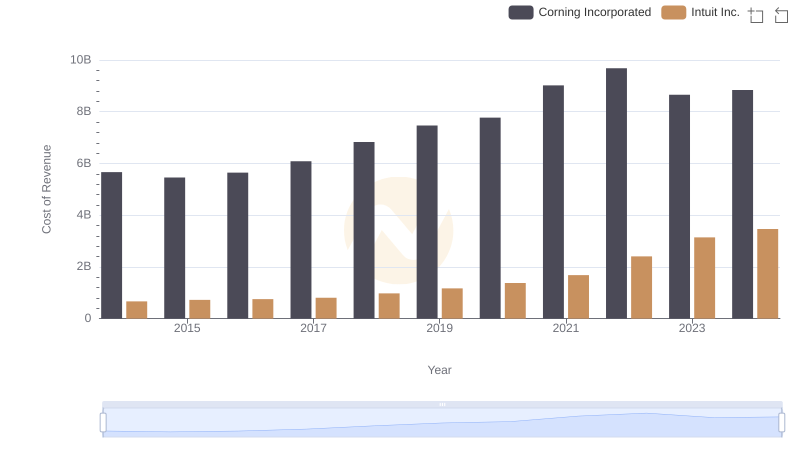
Cost of Revenue Trends: Intuit Inc. vs Corning Incorporated
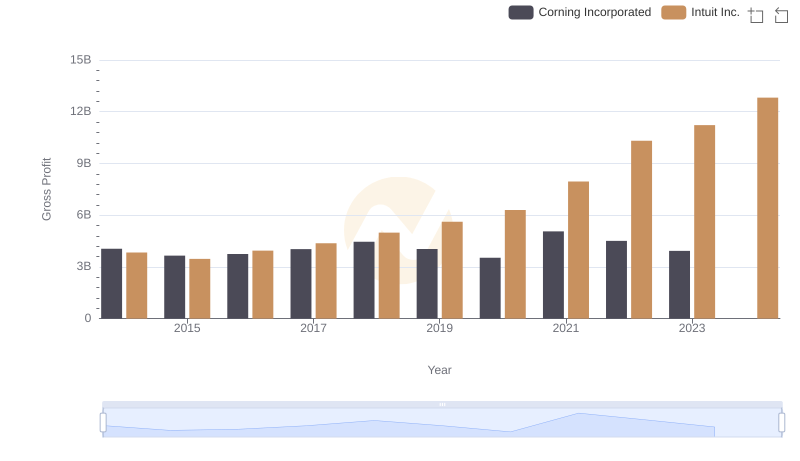
Gross Profit Trends Compared: Intuit Inc. vs Corning Incorporated
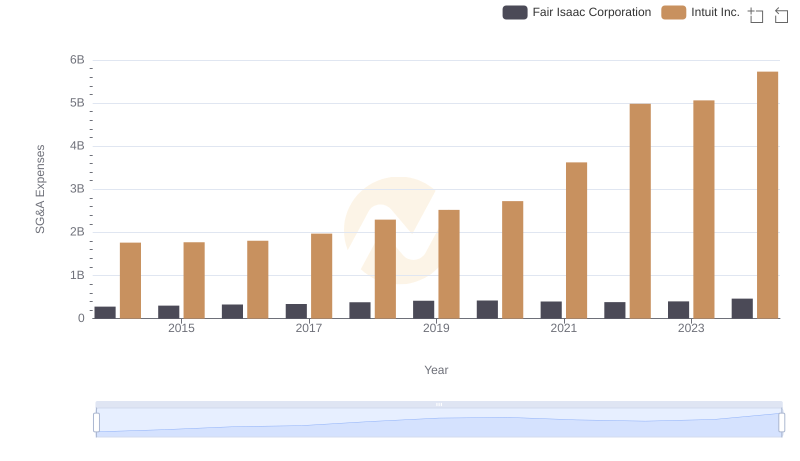
Comparing SG&A Expenses: Intuit Inc. vs Fair Isaac Corporation Trends and Insights
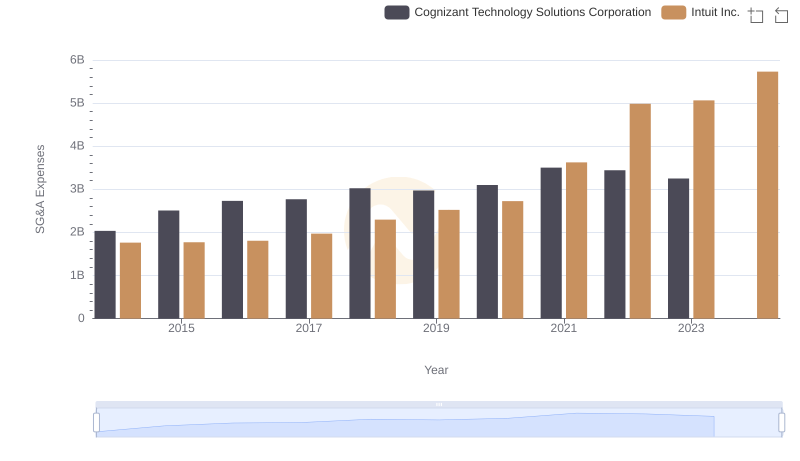
Cost Management Insights: SG&A Expenses for Intuit Inc. and Cognizant Technology Solutions Corporation
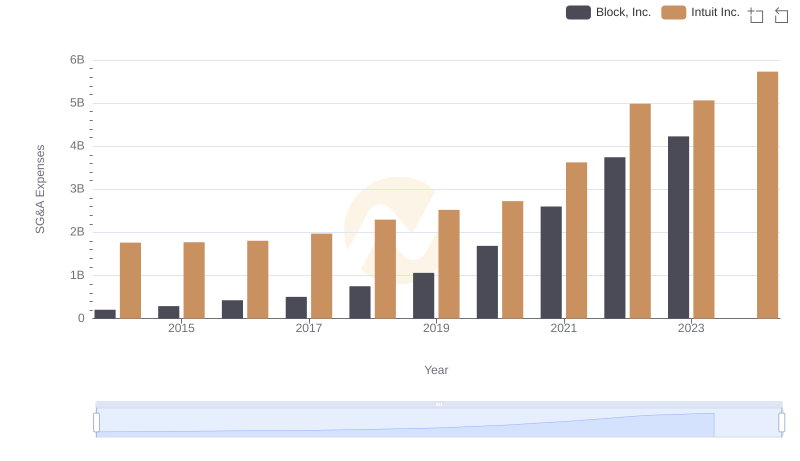
Intuit Inc. vs Block, Inc.: SG&A Expense Trends
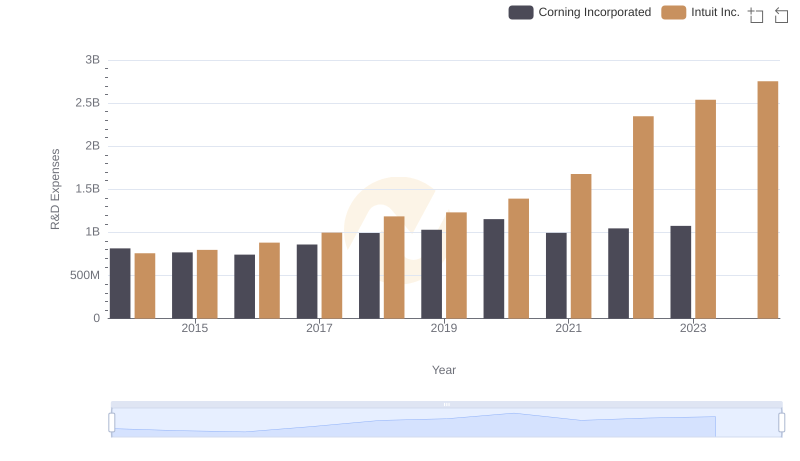
Analyzing R&D Budgets: Intuit Inc. vs Corning Incorporated
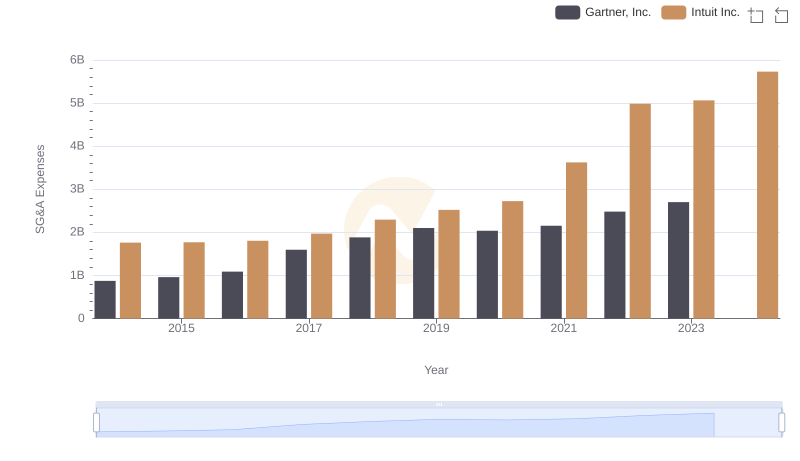
Intuit Inc. vs Gartner, Inc.: SG&A Expense Trends
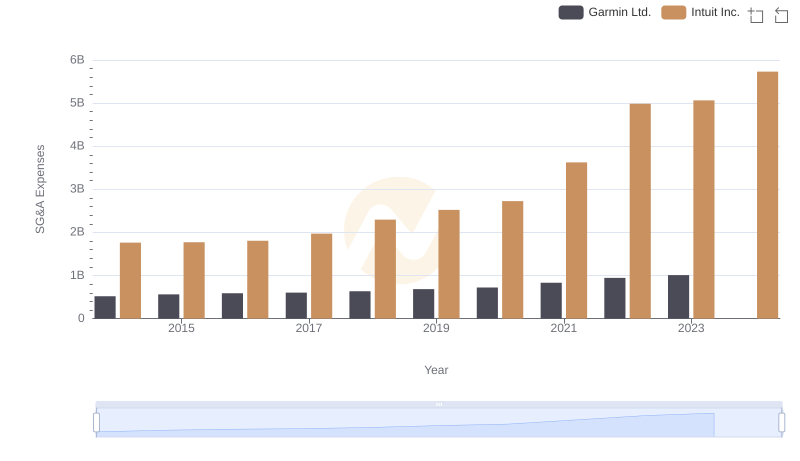
Who Optimizes SG&A Costs Better? Intuit Inc. or Garmin Ltd.
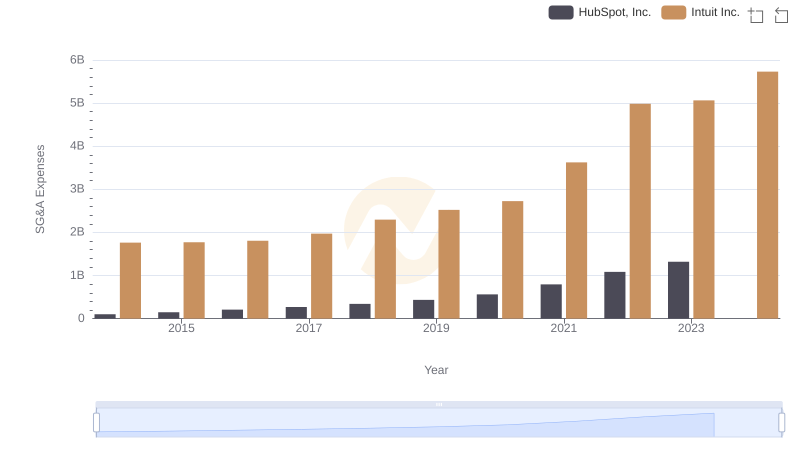
Intuit Inc. or HubSpot, Inc.: Who Manages SG&A Costs Better?
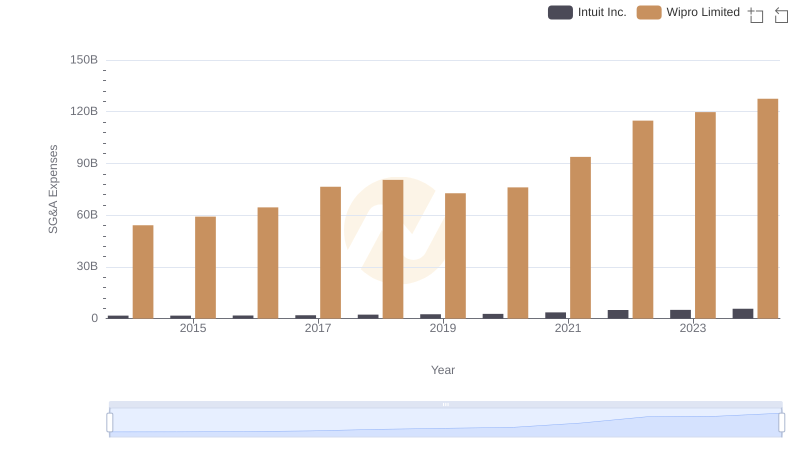
Breaking Down SG&A Expenses: Intuit Inc. vs Wipro Limited
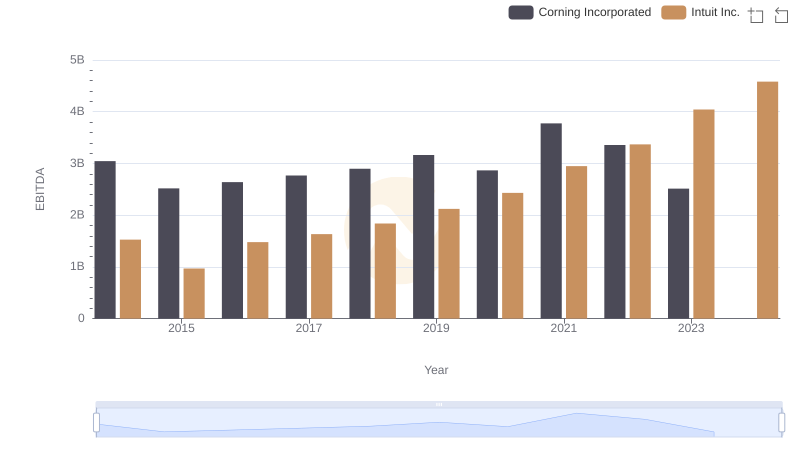
EBITDA Metrics Evaluated: Intuit Inc. vs Corning Incorporated