| __timestamp | Corning Incorporated | Intuit Inc. |
|---|---|---|
| Wednesday, January 1, 2014 | 3046000000 | 1528000000 |
| Thursday, January 1, 2015 | 2517000000 | 970000000 |
| Friday, January 1, 2016 | 2640000000 | 1480000000 |
| Sunday, January 1, 2017 | 2766000000 | 1634000000 |
| Monday, January 1, 2018 | 2897000000 | 1839000000 |
| Tuesday, January 1, 2019 | 3163000000 | 2121000000 |
| Wednesday, January 1, 2020 | 2865000000 | 2430000000 |
| Friday, January 1, 2021 | 3774000000 | 2948000000 |
| Saturday, January 1, 2022 | 3357000000 | 3369000000 |
| Sunday, January 1, 2023 | 2514000000 | 4043000000 |
| Monday, January 1, 2024 | 2492000000 | 4581000000 |
Unleashing insights
In the ever-evolving landscape of corporate finance, the EBITDA (Earnings Before Interest, Taxes, Depreciation, and Amortization) metric serves as a crucial indicator of a company's operational performance. This analysis juxtaposes the financial trajectories of Intuit Inc. and Corning Incorporated from 2014 to 2023.
Corning Incorporated, a leader in materials science, showcased a relatively stable EBITDA, peaking in 2021 with a 24% increase from its 2015 low. However, 2023 saw a dip, reflecting potential market challenges. In contrast, Intuit Inc., a titan in financial software, demonstrated a robust growth trajectory, with its EBITDA surging by over 160% from 2014 to 2023. Notably, Intuit's 2023 EBITDA outpaced Corning's by a significant margin, underscoring its dynamic growth strategy.
While Corning's data for 2024 remains elusive, Intuit's continued upward trend suggests a promising future.
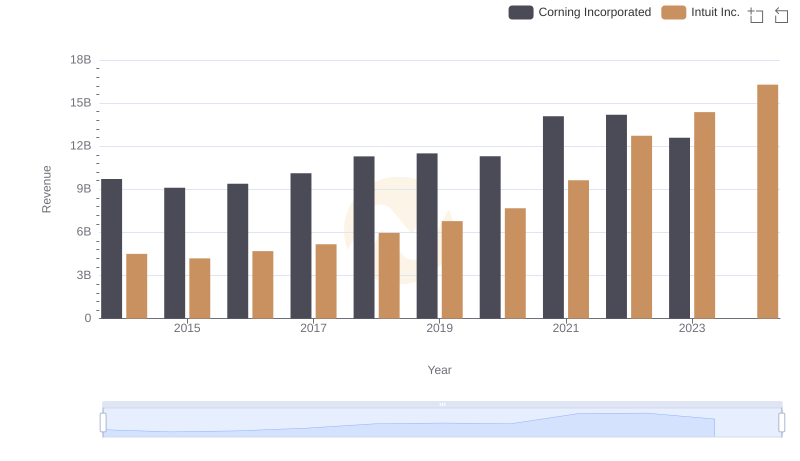
Intuit Inc. vs Corning Incorporated: Examining Key Revenue Metrics
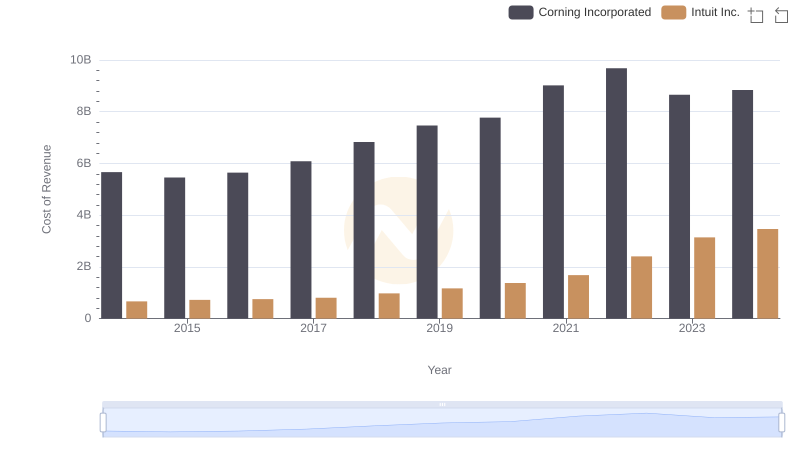
Cost of Revenue Trends: Intuit Inc. vs Corning Incorporated
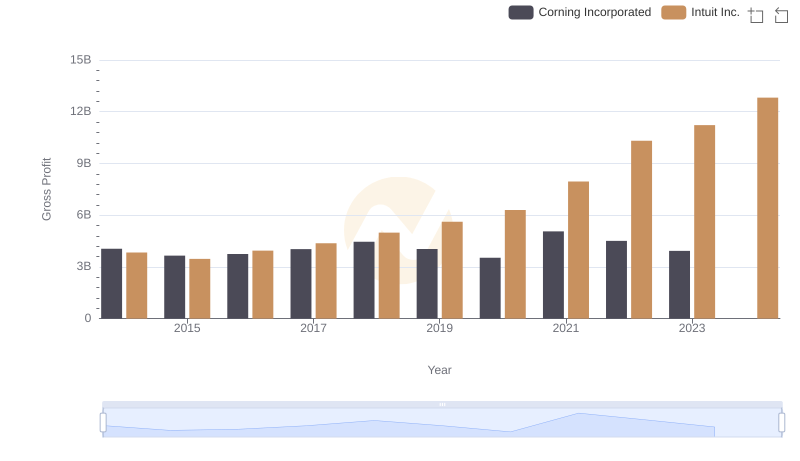
Gross Profit Trends Compared: Intuit Inc. vs Corning Incorporated
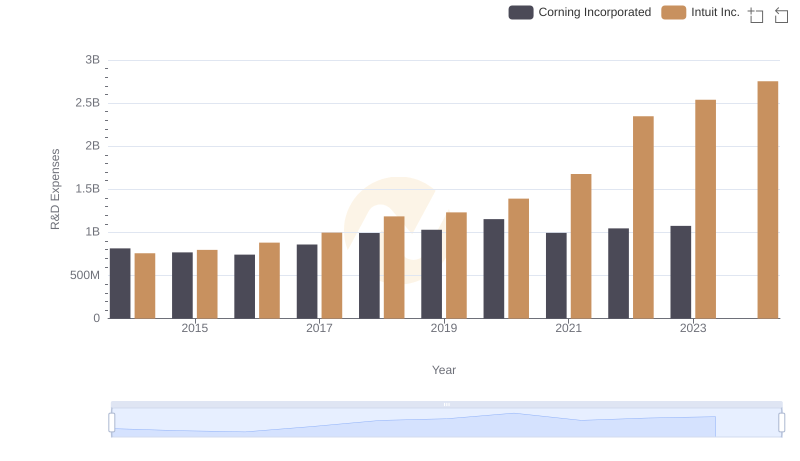
Analyzing R&D Budgets: Intuit Inc. vs Corning Incorporated
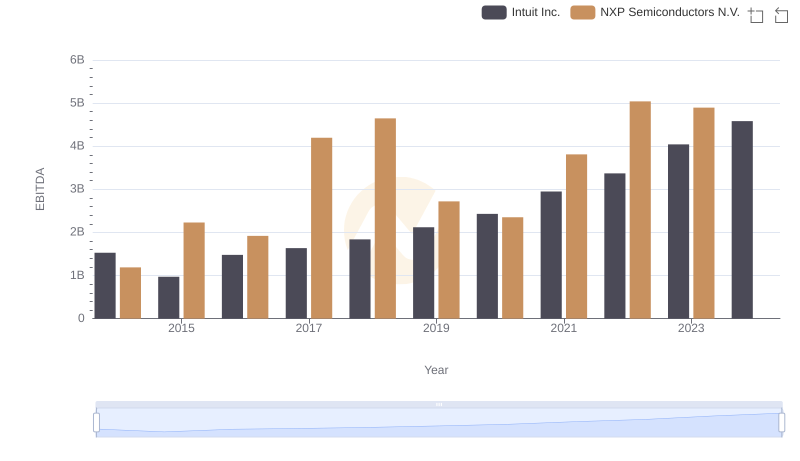
Professional EBITDA Benchmarking: Intuit Inc. vs NXP Semiconductors N.V.
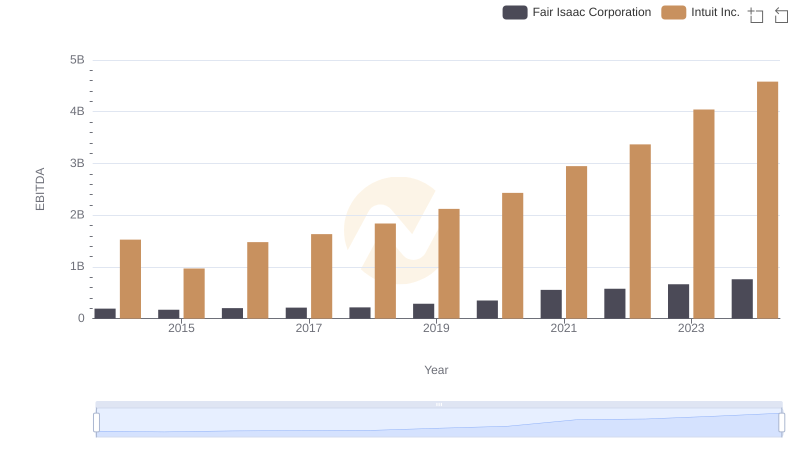
EBITDA Analysis: Evaluating Intuit Inc. Against Fair Isaac Corporation
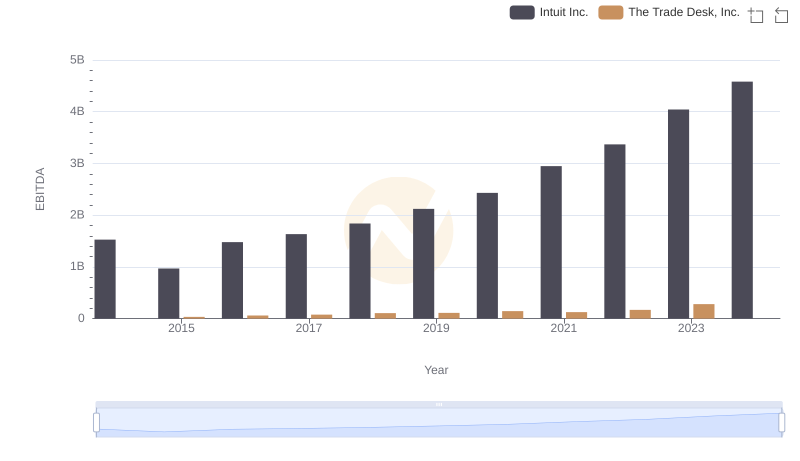
EBITDA Metrics Evaluated: Intuit Inc. vs The Trade Desk, Inc.
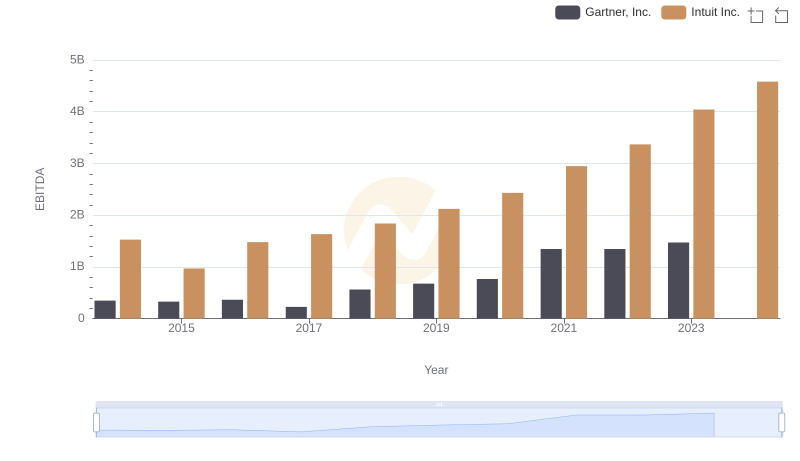
A Professional Review of EBITDA: Intuit Inc. Compared to Gartner, Inc.
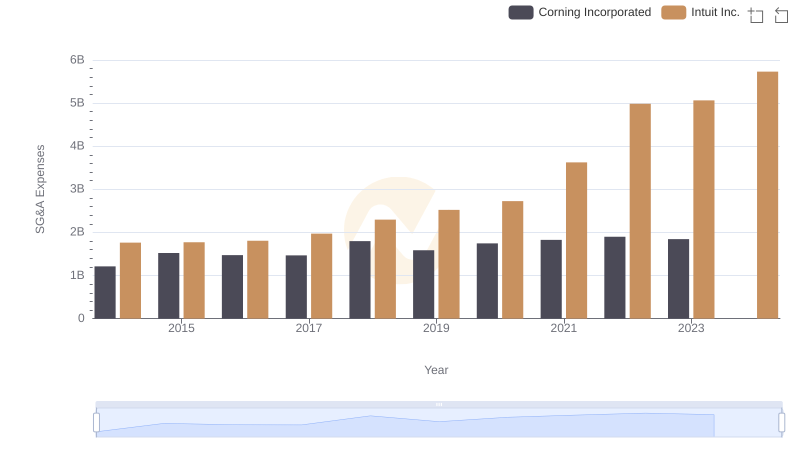
Selling, General, and Administrative Costs: Intuit Inc. vs Corning Incorporated
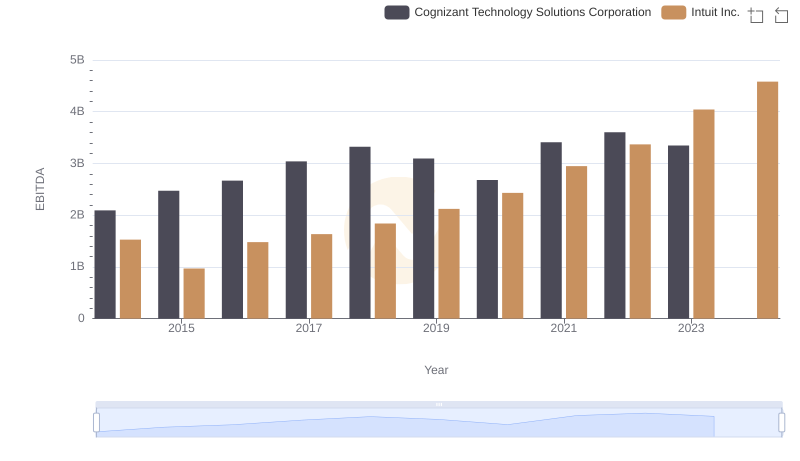
Comparative EBITDA Analysis: Intuit Inc. vs Cognizant Technology Solutions Corporation
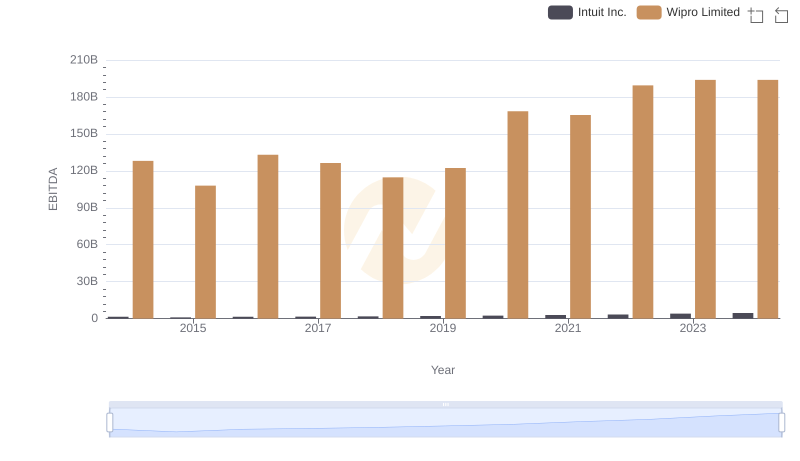
A Professional Review of EBITDA: Intuit Inc. Compared to Wipro Limited
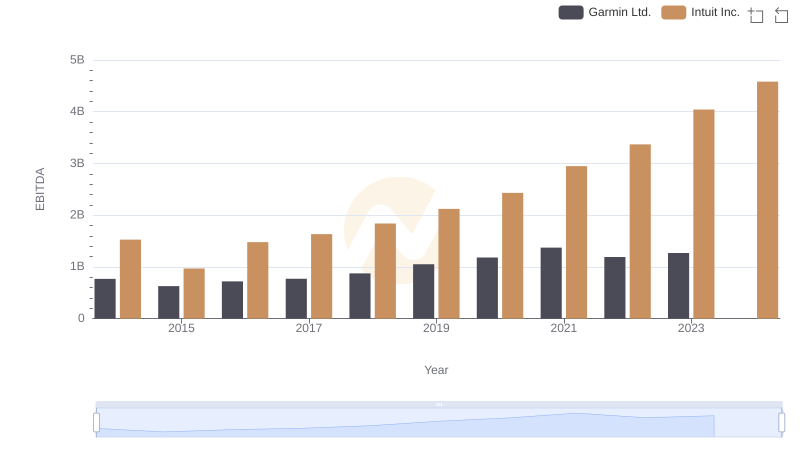
Intuit Inc. vs Garmin Ltd.: In-Depth EBITDA Performance Comparison