| __timestamp | Corning Incorporated | Intuit Inc. |
|---|---|---|
| Wednesday, January 1, 2014 | 9715000000 | 4506000000 |
| Thursday, January 1, 2015 | 9111000000 | 4192000000 |
| Friday, January 1, 2016 | 9390000000 | 4694000000 |
| Sunday, January 1, 2017 | 10116000000 | 5177000000 |
| Monday, January 1, 2018 | 11290000000 | 5964000000 |
| Tuesday, January 1, 2019 | 11503000000 | 6784000000 |
| Wednesday, January 1, 2020 | 11303000000 | 7679000000 |
| Friday, January 1, 2021 | 14082000000 | 9633000000 |
| Saturday, January 1, 2022 | 14189000000 | 12726000000 |
| Sunday, January 1, 2023 | 12588000000 | 14368000000 |
| Monday, January 1, 2024 | 13118000000 | 16285000000 |
Unlocking the unknown
In the ever-evolving landscape of American business, Intuit Inc. and Corning Incorporated stand as titans in their respective fields. From 2014 to 2023, these companies have showcased remarkable revenue trajectories, reflecting broader economic trends and strategic business decisions.
Corning Incorporated, a leader in materials science, saw its revenue grow by approximately 38% over the decade, peaking in 2022. Meanwhile, Intuit Inc., a powerhouse in financial software, experienced a staggering 219% increase, culminating in 2023 with revenues surpassing Corning's by 14%.
While Corning's revenue remained relatively stable, Intuit's growth trajectory was more dynamic, particularly from 2020 onwards. This period marked a digital transformation surge, likely fueled by increased demand for financial software solutions.
As we move into 2024, Intuit's continued growth is anticipated, though Corning's data remains elusive. This missing data invites speculation on future trends and potential market shifts.
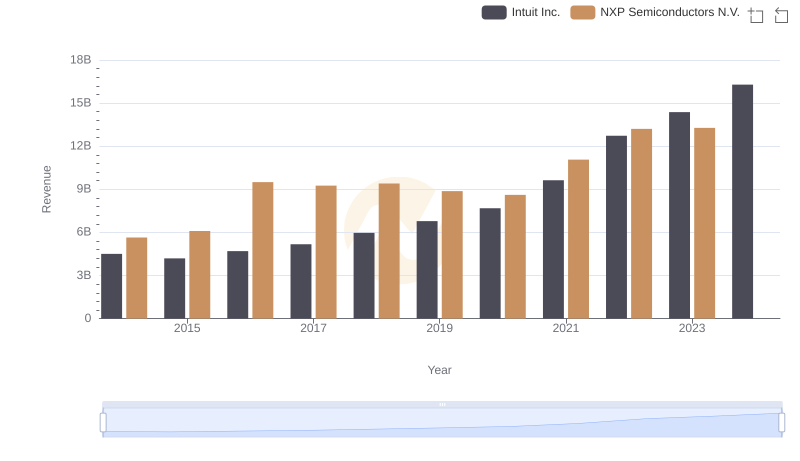
Intuit Inc. and NXP Semiconductors N.V.: A Comprehensive Revenue Analysis
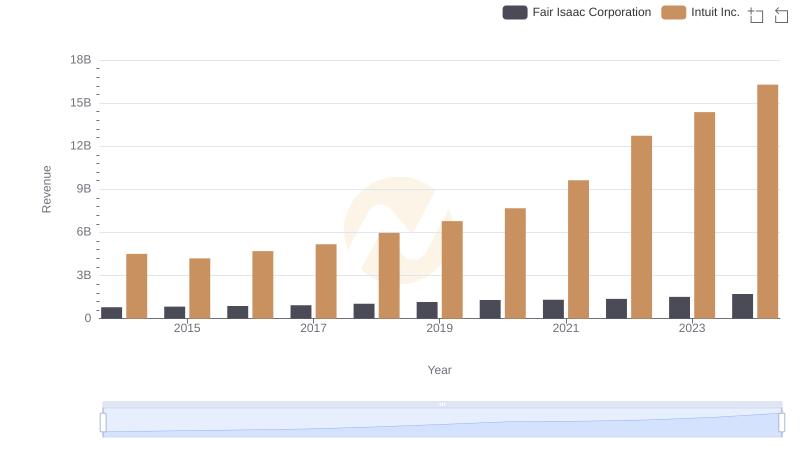
Revenue Insights: Intuit Inc. and Fair Isaac Corporation Performance Compared
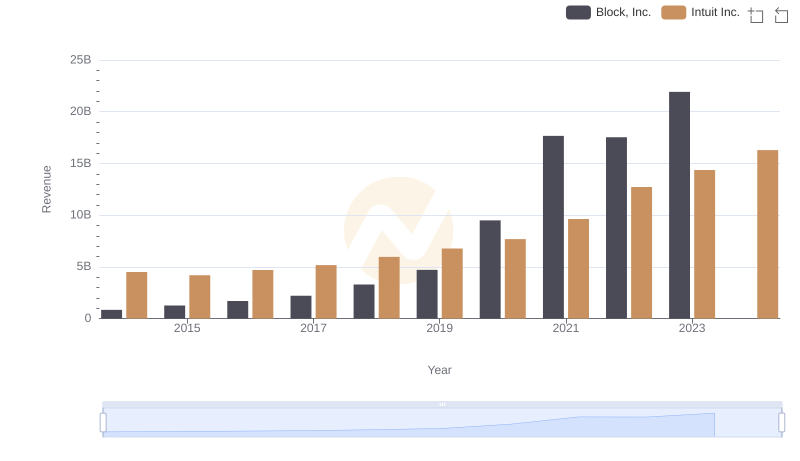
Breaking Down Revenue Trends: Intuit Inc. vs Block, Inc.
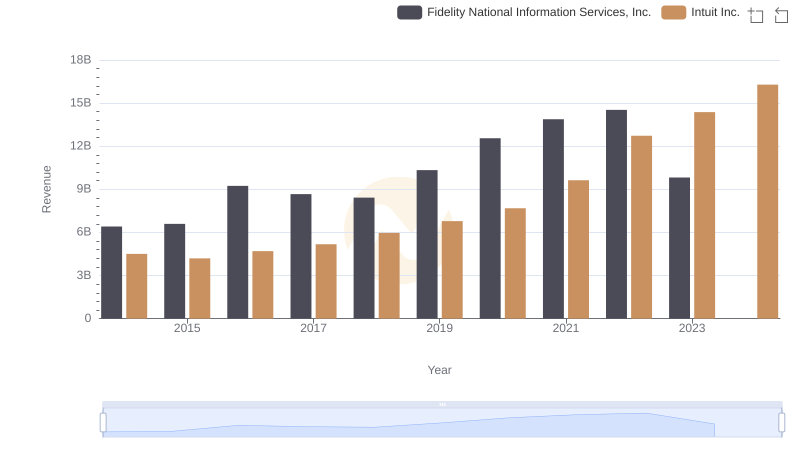
Revenue Insights: Intuit Inc. and Fidelity National Information Services, Inc. Performance Compared
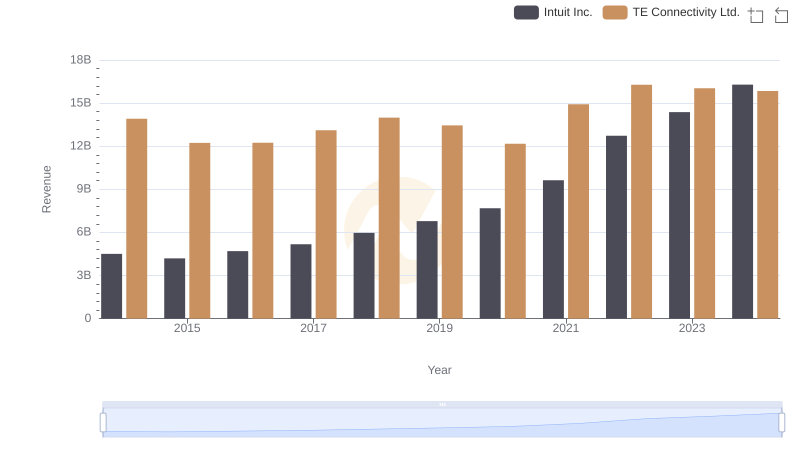
Annual Revenue Comparison: Intuit Inc. vs TE Connectivity Ltd.
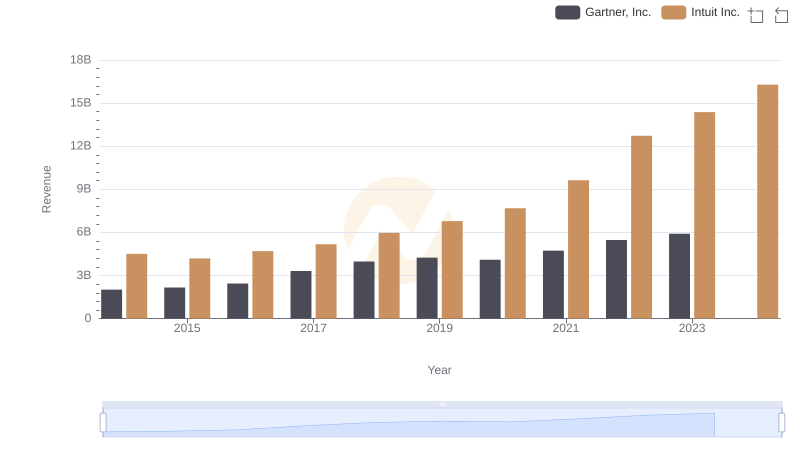
Intuit Inc. and Gartner, Inc.: A Comprehensive Revenue Analysis
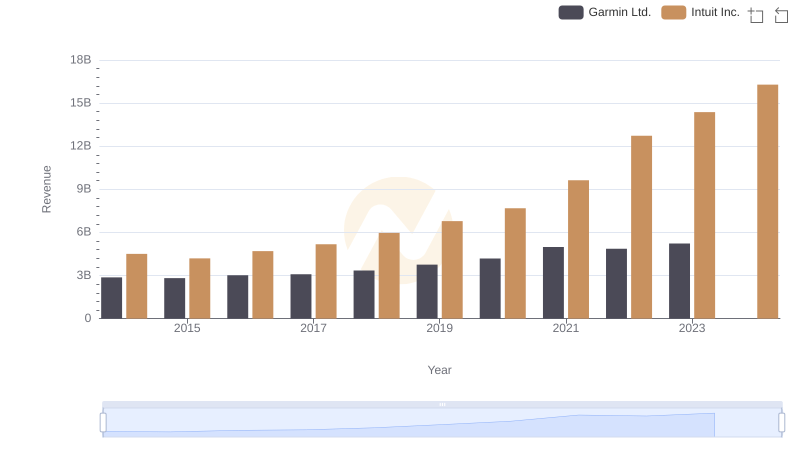
Revenue Showdown: Intuit Inc. vs Garmin Ltd.
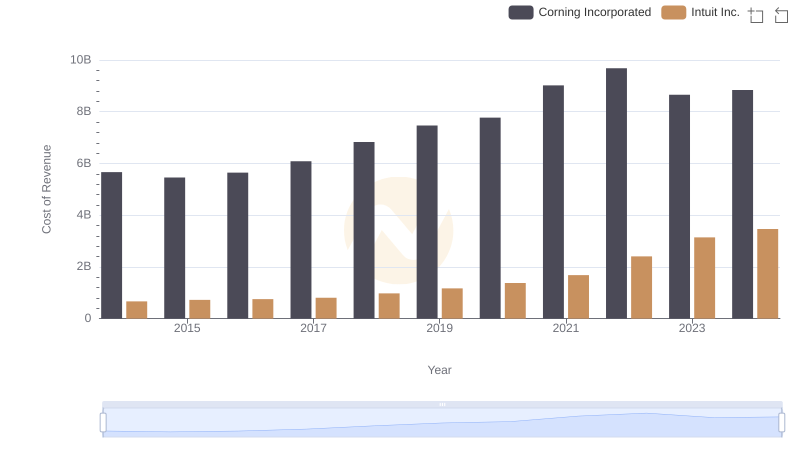
Cost of Revenue Trends: Intuit Inc. vs Corning Incorporated
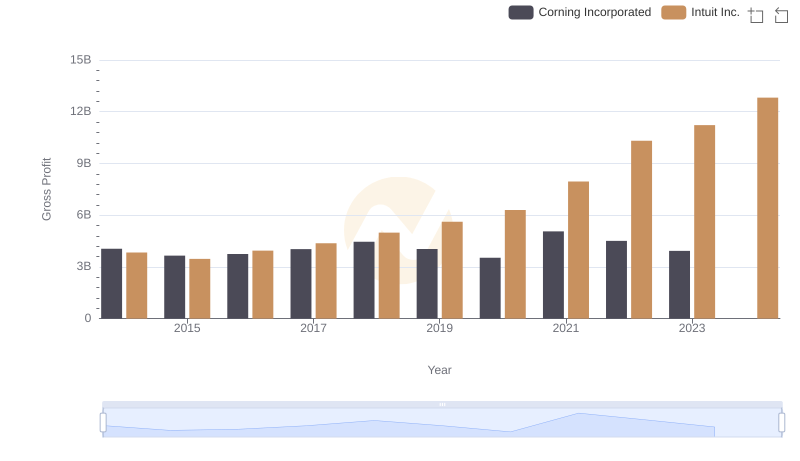
Gross Profit Trends Compared: Intuit Inc. vs Corning Incorporated
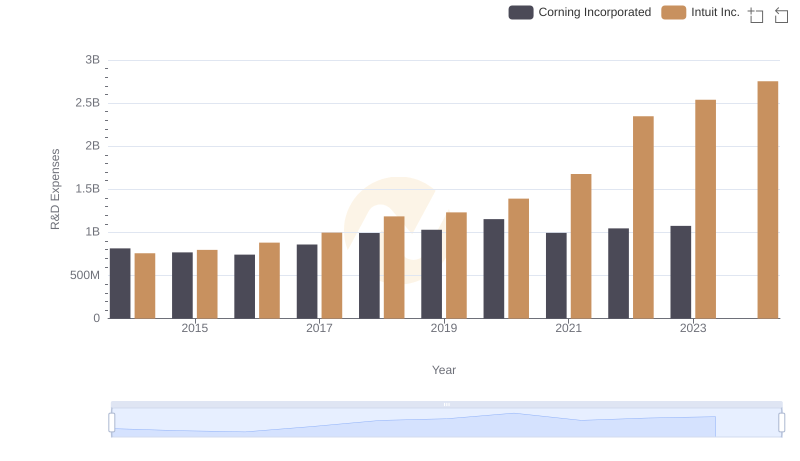
Analyzing R&D Budgets: Intuit Inc. vs Corning Incorporated
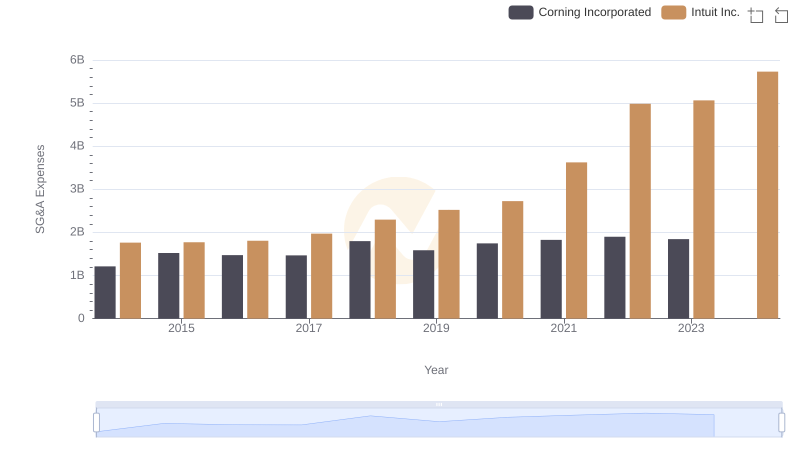
Selling, General, and Administrative Costs: Intuit Inc. vs Corning Incorporated
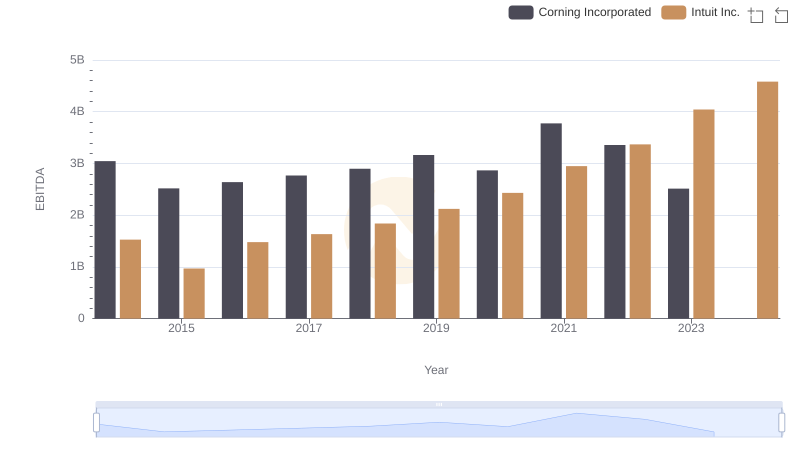
EBITDA Metrics Evaluated: Intuit Inc. vs Corning Incorporated