| __timestamp | Intuit Inc. | Wipro Limited |
|---|---|---|
| Wednesday, January 1, 2014 | 1762000000 | 54144000000 |
| Thursday, January 1, 2015 | 1771000000 | 59142000000 |
| Friday, January 1, 2016 | 1807000000 | 64514000000 |
| Sunday, January 1, 2017 | 1973000000 | 76490000000 |
| Monday, January 1, 2018 | 2298000000 | 80461000000 |
| Tuesday, January 1, 2019 | 2524000000 | 72730000000 |
| Wednesday, January 1, 2020 | 2727000000 | 76086000000 |
| Friday, January 1, 2021 | 3626000000 | 93805000000 |
| Saturday, January 1, 2022 | 4986000000 | 114803000000 |
| Sunday, January 1, 2023 | 5062000000 | 119755000000 |
| Monday, January 1, 2024 | 5730000000 | 127509000000 |
Infusing magic into the data realm
In the ever-evolving landscape of global business, understanding the financial dynamics of industry leaders is crucial. This analysis delves into the Selling, General, and Administrative (SG&A) expenses of two titans: Intuit Inc. and Wipro Limited, from 2014 to 2024. Over this decade, Intuit's SG&A expenses have surged by over 225%, reflecting its aggressive growth strategy and market expansion. In contrast, Wipro's expenses have increased by approximately 135%, showcasing its steady and robust operational scale.
By 2024, Wipro's SG&A expenses are nearly 22 times those of Intuit, highlighting the vast difference in their operational scales. This comparison not only underscores the diverse strategies of these companies but also offers insights into their financial health and market positioning. As businesses navigate the complexities of the modern economy, such insights are invaluable for investors and analysts alike.
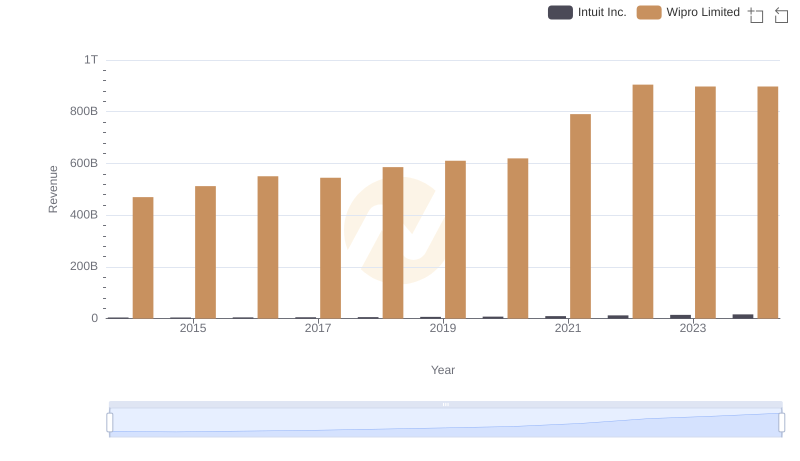
Intuit Inc. or Wipro Limited: Who Leads in Yearly Revenue?
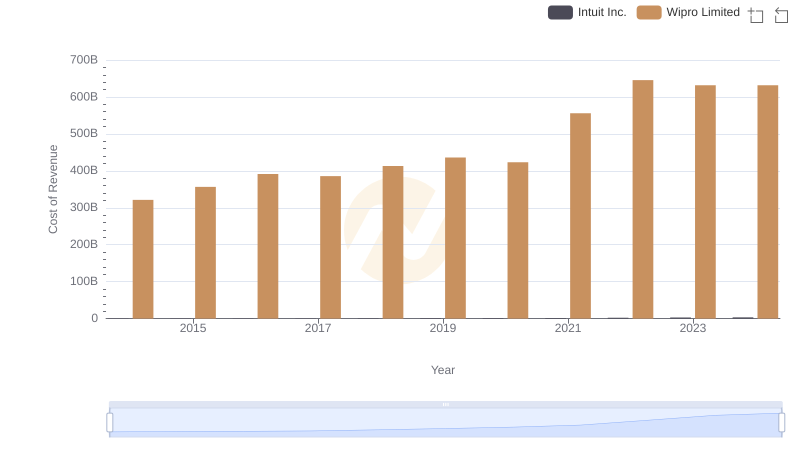
Cost of Revenue: Key Insights for Intuit Inc. and Wipro Limited
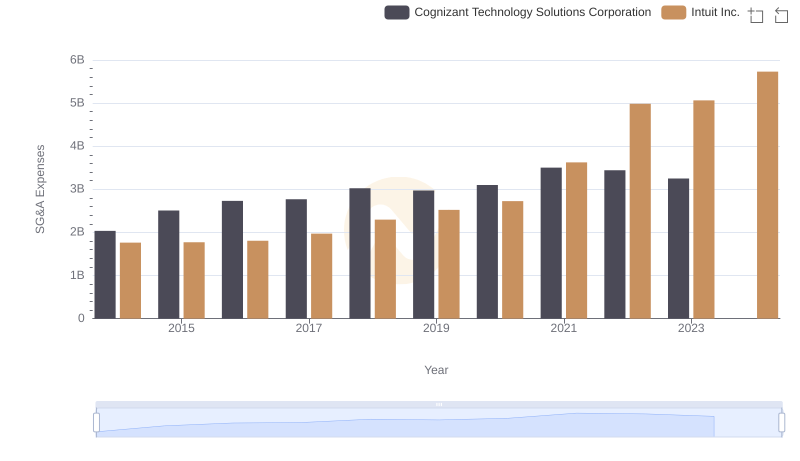
Cost Management Insights: SG&A Expenses for Intuit Inc. and Cognizant Technology Solutions Corporation
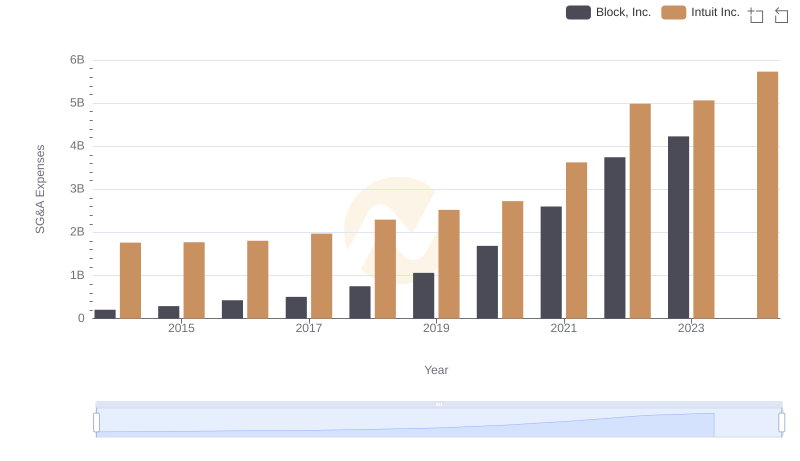
Intuit Inc. vs Block, Inc.: SG&A Expense Trends
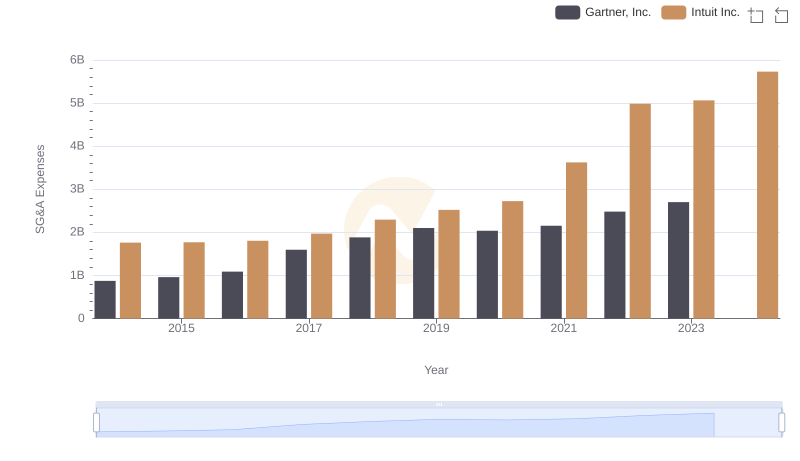
Intuit Inc. vs Gartner, Inc.: SG&A Expense Trends
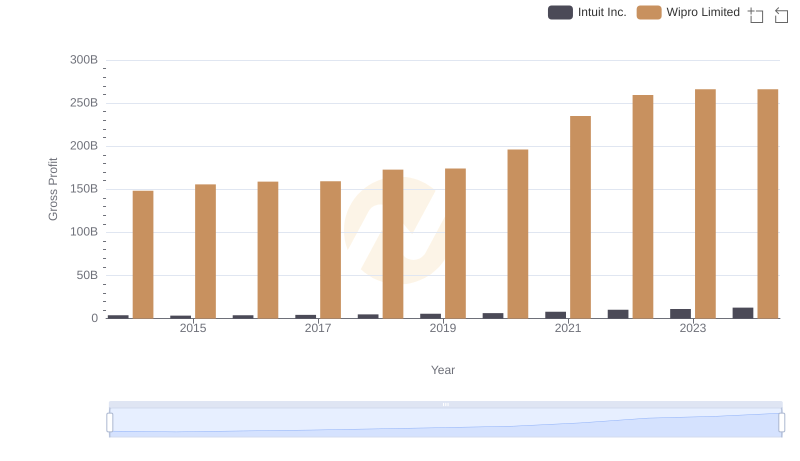
Gross Profit Trends Compared: Intuit Inc. vs Wipro Limited
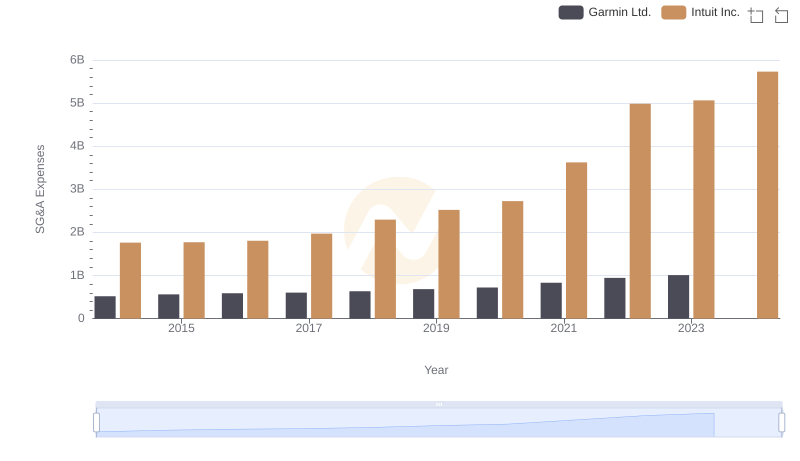
Who Optimizes SG&A Costs Better? Intuit Inc. or Garmin Ltd.
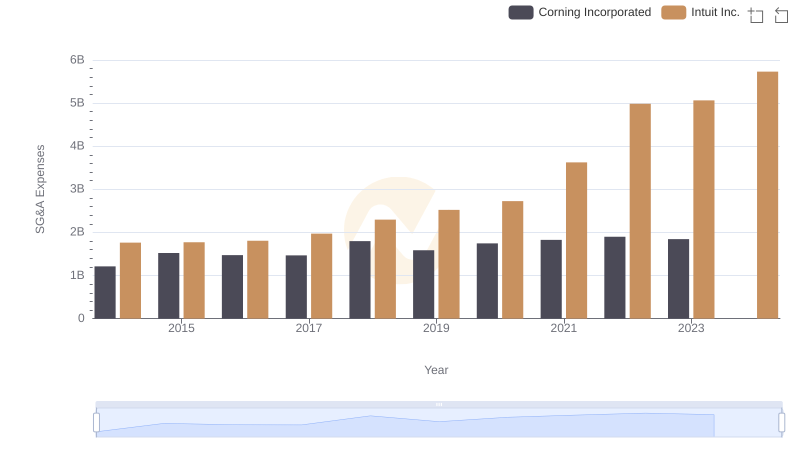
Selling, General, and Administrative Costs: Intuit Inc. vs Corning Incorporated
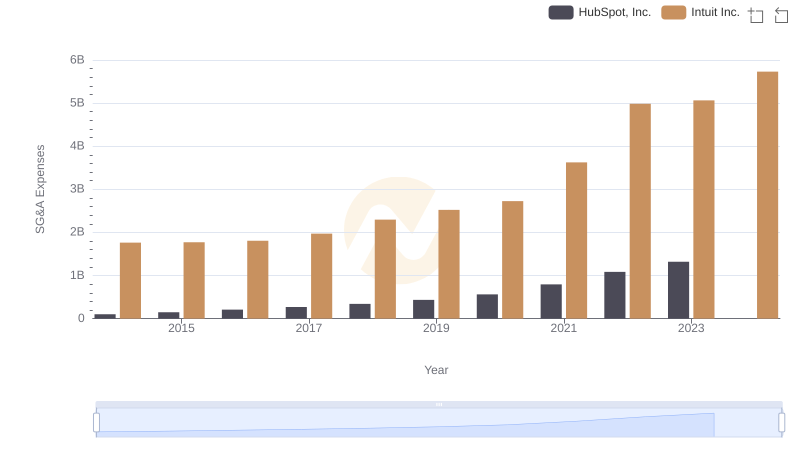
Intuit Inc. or HubSpot, Inc.: Who Manages SG&A Costs Better?
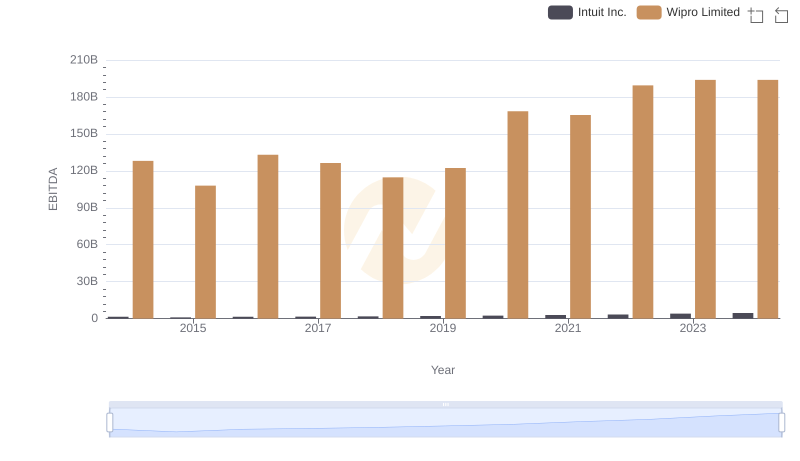
A Professional Review of EBITDA: Intuit Inc. Compared to Wipro Limited
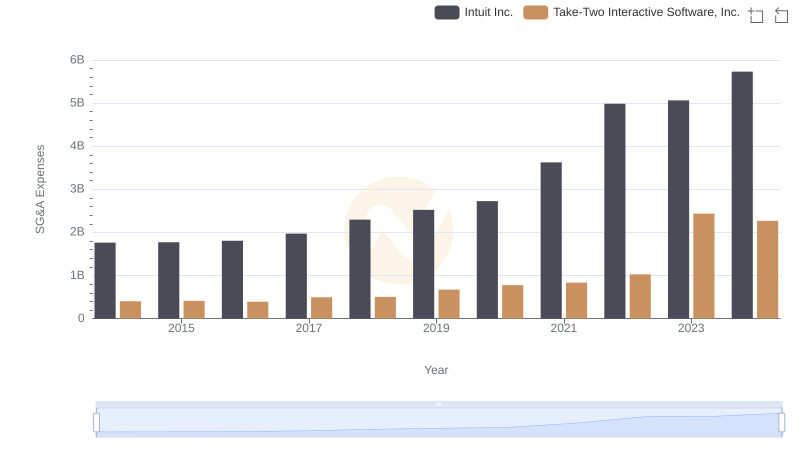
Comparing SG&A Expenses: Intuit Inc. vs Take-Two Interactive Software, Inc. Trends and Insights
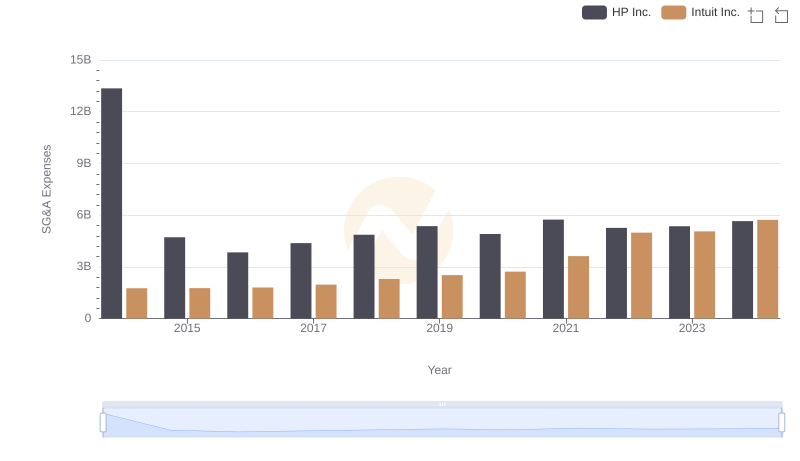
Intuit Inc. and HP Inc.: SG&A Spending Patterns Compared