| __timestamp | Gartner, Inc. | Intuit Inc. |
|---|---|---|
| Wednesday, January 1, 2014 | 876067000 | 1762000000 |
| Thursday, January 1, 2015 | 962677000 | 1771000000 |
| Friday, January 1, 2016 | 1089184000 | 1807000000 |
| Sunday, January 1, 2017 | 1599004000 | 1973000000 |
| Monday, January 1, 2018 | 1884141000 | 2298000000 |
| Tuesday, January 1, 2019 | 2103424000 | 2524000000 |
| Wednesday, January 1, 2020 | 2039087000 | 2727000000 |
| Friday, January 1, 2021 | 2155724000 | 3626000000 |
| Saturday, January 1, 2022 | 2480846000 | 4986000000 |
| Sunday, January 1, 2023 | 2701542000 | 5062000000 |
| Monday, January 1, 2024 | 2884814000 | 5730000000 |
Igniting the spark of knowledge
In the ever-evolving landscape of corporate finance, understanding the trends in Selling, General, and Administrative (SG&A) expenses is crucial for investors and analysts alike. Over the past decade, Intuit Inc. and Gartner, Inc. have shown distinct trajectories in their SG&A expenditures. From 2014 to 2023, Intuit's SG&A expenses surged by approximately 187%, reflecting its aggressive growth strategy and expansion efforts. In contrast, Gartner's expenses increased by about 208%, indicating its commitment to scaling operations and enhancing market presence.
Notably, Intuit's SG&A expenses reached a peak of $5.73 billion in 2024, while Gartner's expenses topped at $2.70 billion in 2023. This divergence highlights the differing operational strategies and market dynamics faced by these industry giants. Missing data for Gartner in 2024 suggests potential shifts or strategic pivots. As these companies continue to navigate the competitive landscape, their SG&A trends offer valuable insights into their financial health and strategic priorities.
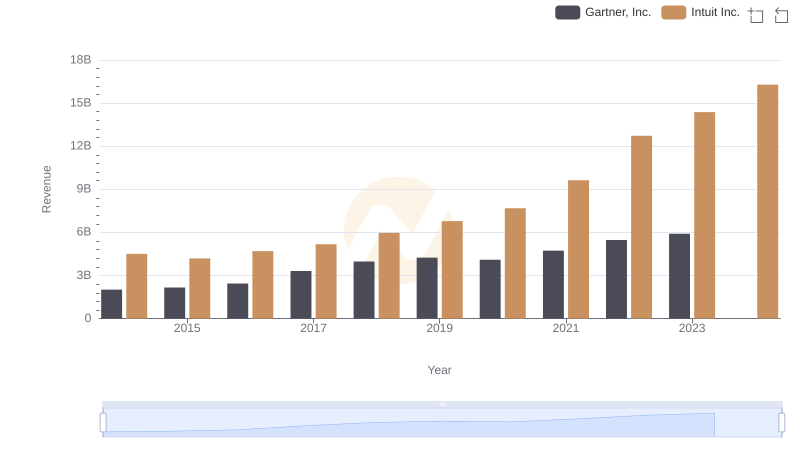
Intuit Inc. and Gartner, Inc.: A Comprehensive Revenue Analysis
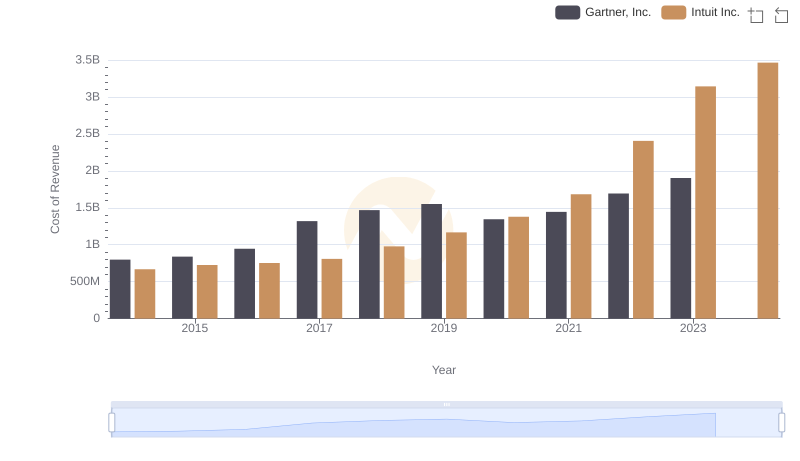
Intuit Inc. vs Gartner, Inc.: Efficiency in Cost of Revenue Explored
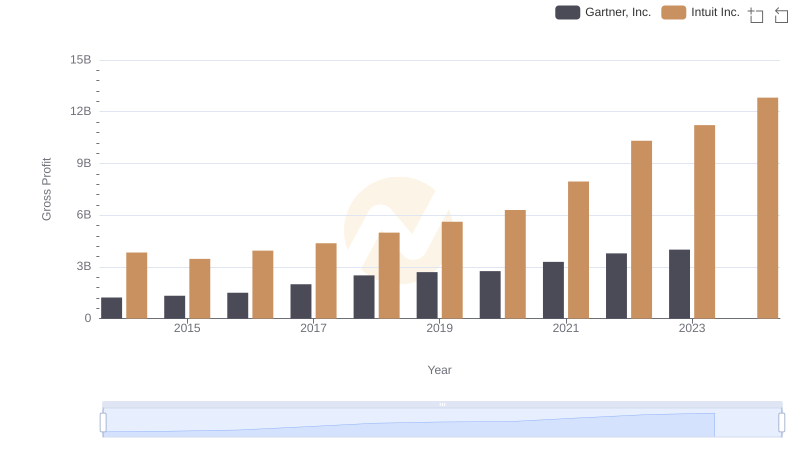
Who Generates Higher Gross Profit? Intuit Inc. or Gartner, Inc.
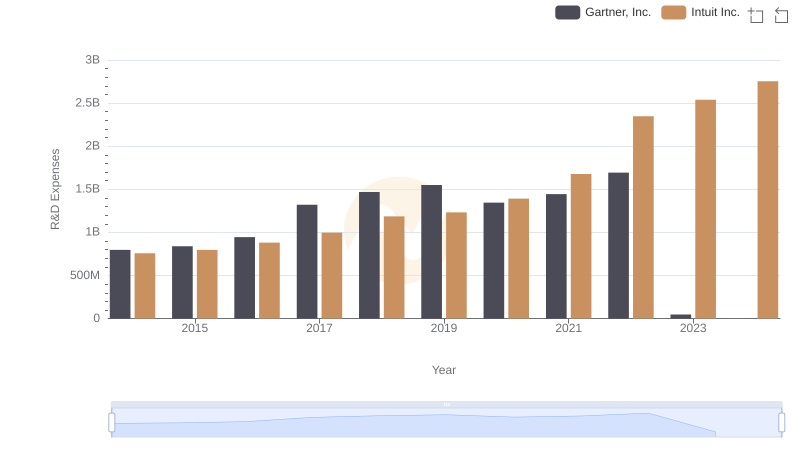
Intuit Inc. vs Gartner, Inc.: Strategic Focus on R&D Spending
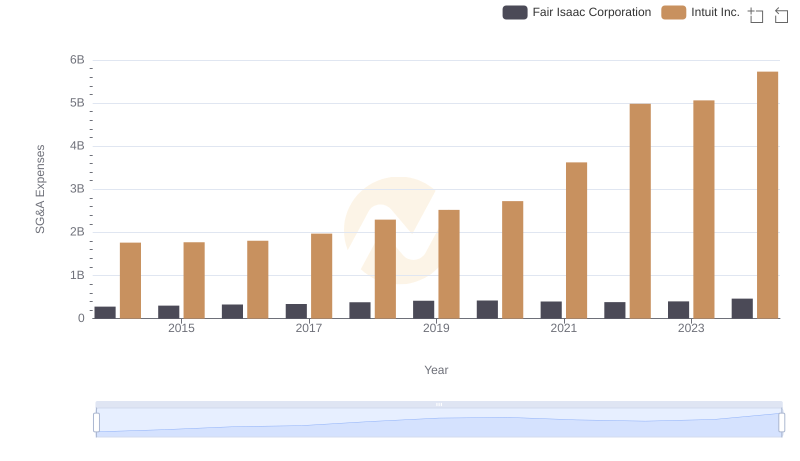
Comparing SG&A Expenses: Intuit Inc. vs Fair Isaac Corporation Trends and Insights
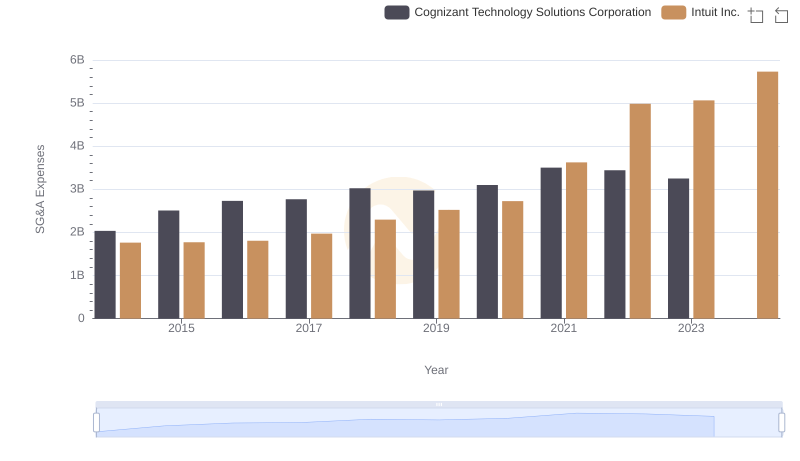
Cost Management Insights: SG&A Expenses for Intuit Inc. and Cognizant Technology Solutions Corporation
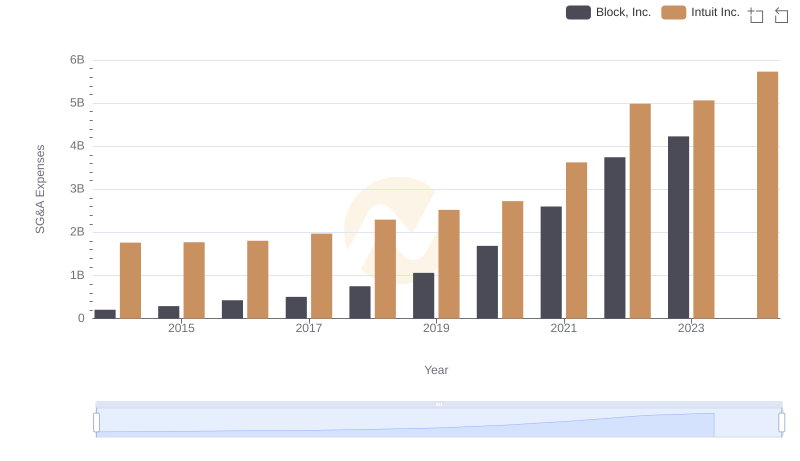
Intuit Inc. vs Block, Inc.: SG&A Expense Trends
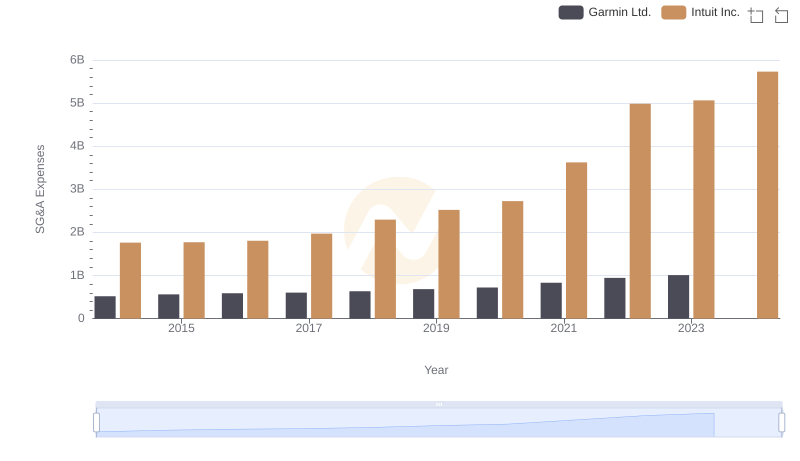
Who Optimizes SG&A Costs Better? Intuit Inc. or Garmin Ltd.
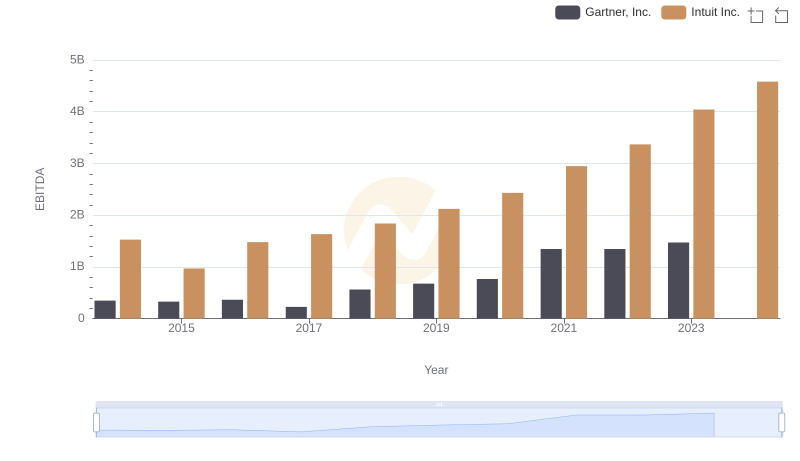
A Professional Review of EBITDA: Intuit Inc. Compared to Gartner, Inc.
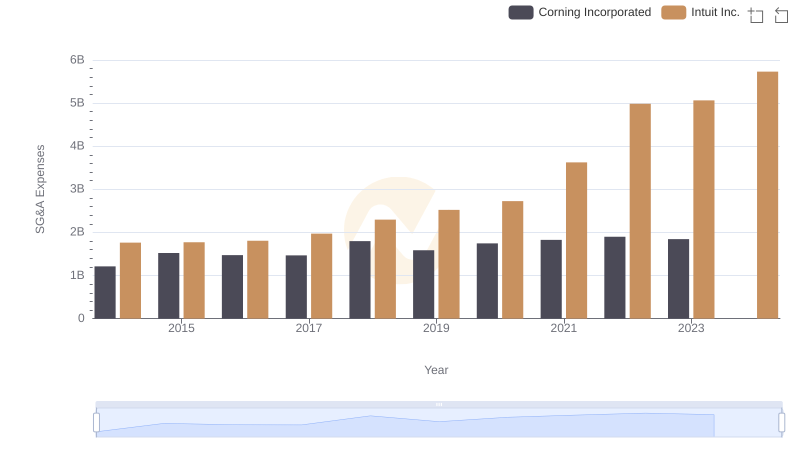
Selling, General, and Administrative Costs: Intuit Inc. vs Corning Incorporated
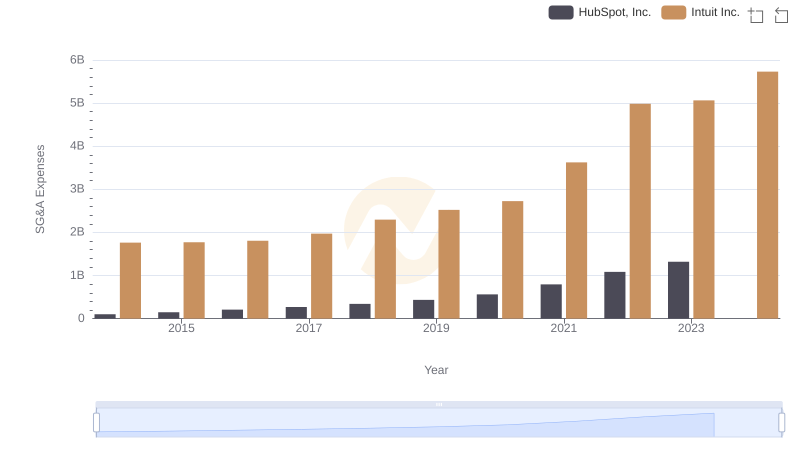
Intuit Inc. or HubSpot, Inc.: Who Manages SG&A Costs Better?
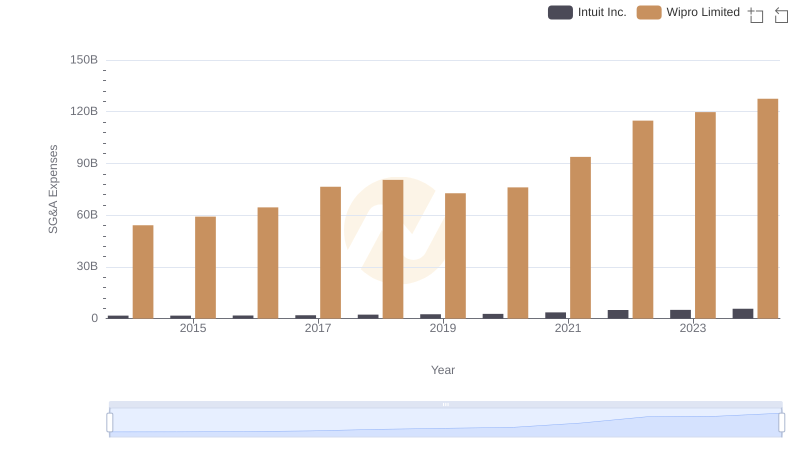
Breaking Down SG&A Expenses: Intuit Inc. vs Wipro Limited