| __timestamp | Corning Incorporated | Intuit Inc. |
|---|---|---|
| Wednesday, January 1, 2014 | 5663000000 | 668000000 |
| Thursday, January 1, 2015 | 5458000000 | 725000000 |
| Friday, January 1, 2016 | 5644000000 | 752000000 |
| Sunday, January 1, 2017 | 6084000000 | 809000000 |
| Monday, January 1, 2018 | 6829000000 | 977000000 |
| Tuesday, January 1, 2019 | 7468000000 | 1167000000 |
| Wednesday, January 1, 2020 | 7772000000 | 1378000000 |
| Friday, January 1, 2021 | 9019000000 | 1683000000 |
| Saturday, January 1, 2022 | 9683000000 | 2406000000 |
| Sunday, January 1, 2023 | 8657000000 | 3143000000 |
| Monday, January 1, 2024 | 8842000000 | 3465000000 |
Unlocking the unknown
In the ever-evolving landscape of corporate finance, understanding cost structures is crucial. This analysis delves into the cost of revenue trends for Intuit Inc. and Corning Incorporated from 2014 to 2024. Over this decade, Corning's cost of revenue has shown a steady increase, peaking in 2022 with a 71% rise from 2014. Meanwhile, Intuit Inc. has experienced a more dramatic surge, with its cost of revenue climbing by over 400% during the same period. This stark contrast highlights the differing operational strategies and market conditions faced by these industry giants. Corning's consistent growth reflects its stable market presence, while Intuit's rapid increase suggests aggressive expansion and investment in new technologies. As we look to the future, these trends offer valuable insights into the financial health and strategic directions of these companies.
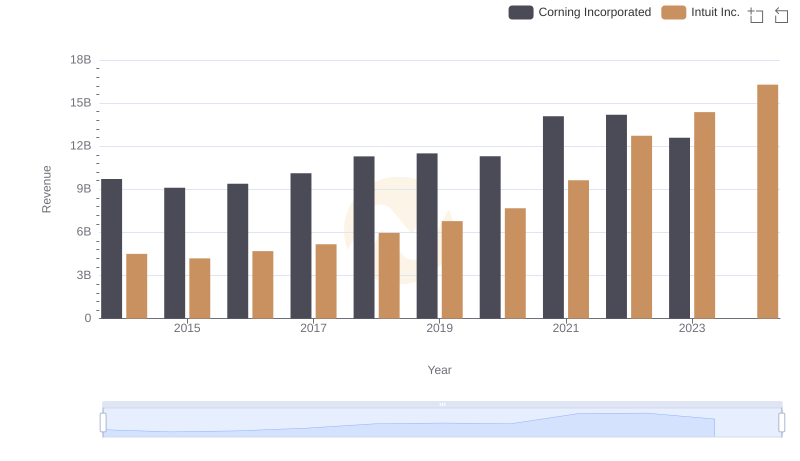
Intuit Inc. vs Corning Incorporated: Examining Key Revenue Metrics
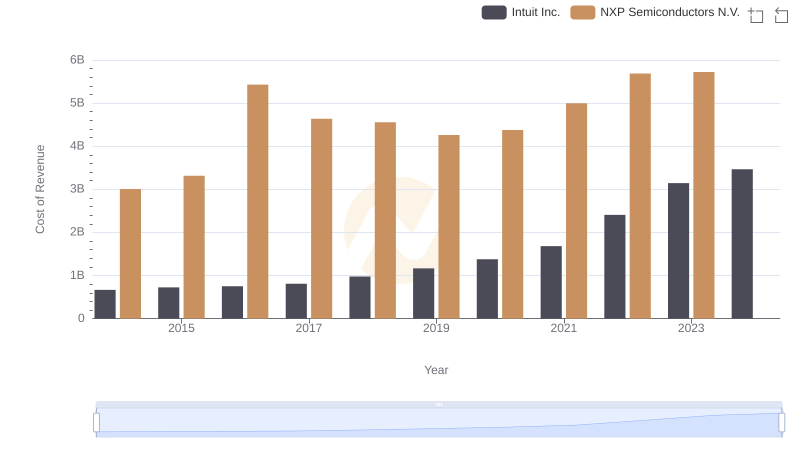
Comparing Cost of Revenue Efficiency: Intuit Inc. vs NXP Semiconductors N.V.
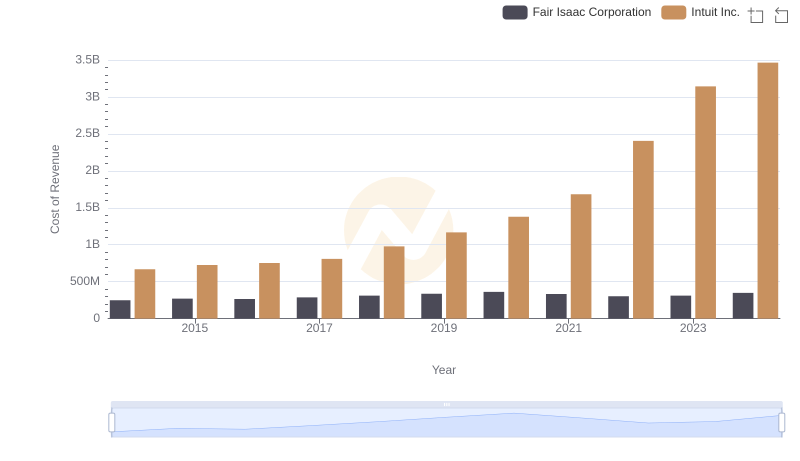
Cost of Revenue Comparison: Intuit Inc. vs Fair Isaac Corporation
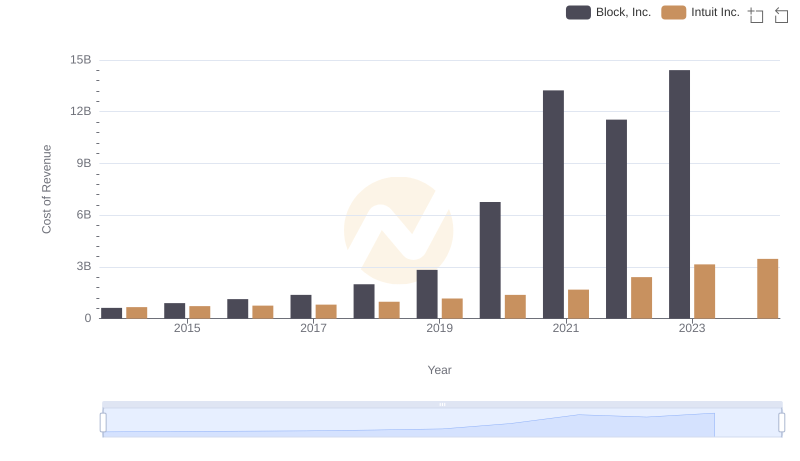
Cost Insights: Breaking Down Intuit Inc. and Block, Inc.'s Expenses
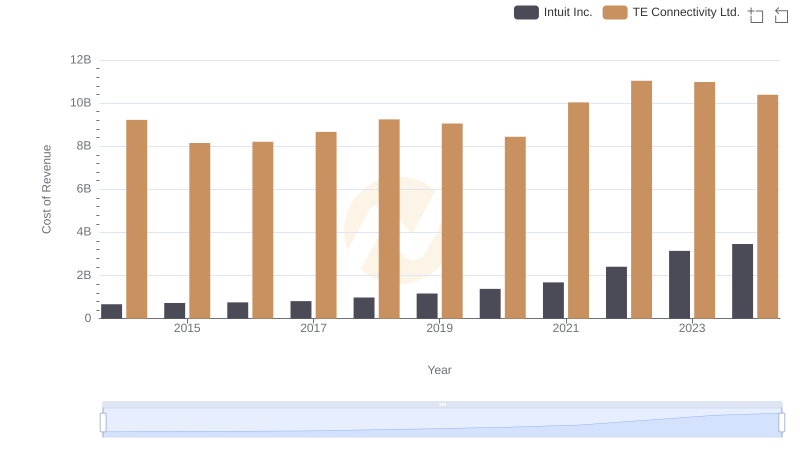
Cost of Revenue: Key Insights for Intuit Inc. and TE Connectivity Ltd.
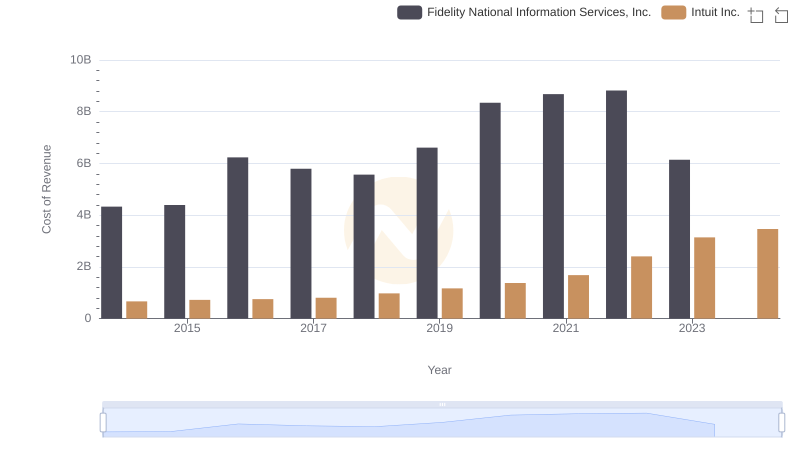
Intuit Inc. vs Fidelity National Information Services, Inc.: Efficiency in Cost of Revenue Explored
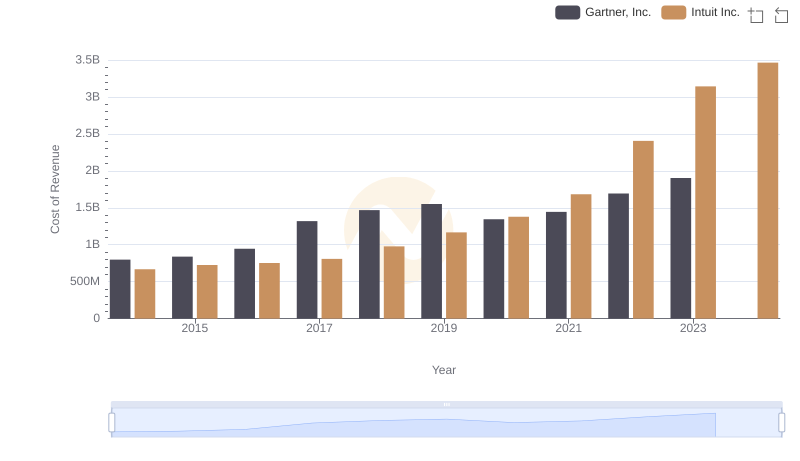
Intuit Inc. vs Gartner, Inc.: Efficiency in Cost of Revenue Explored
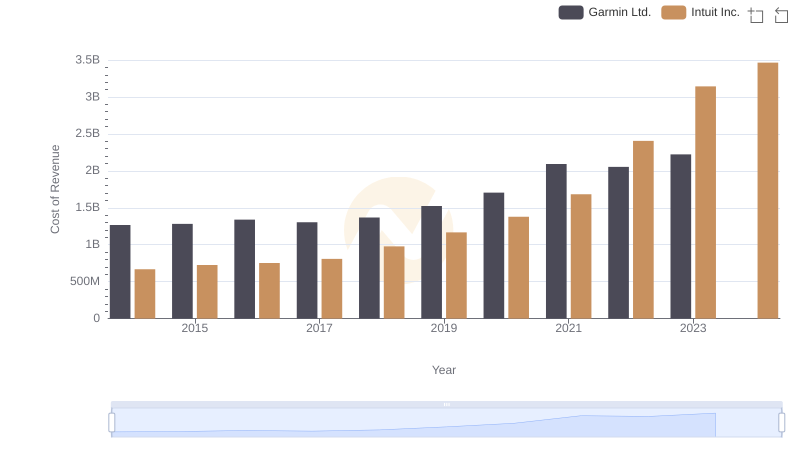
Cost of Revenue Comparison: Intuit Inc. vs Garmin Ltd.
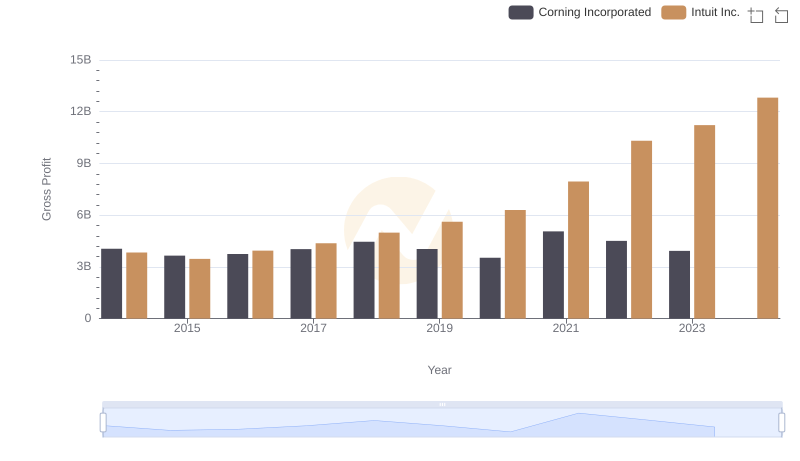
Gross Profit Trends Compared: Intuit Inc. vs Corning Incorporated
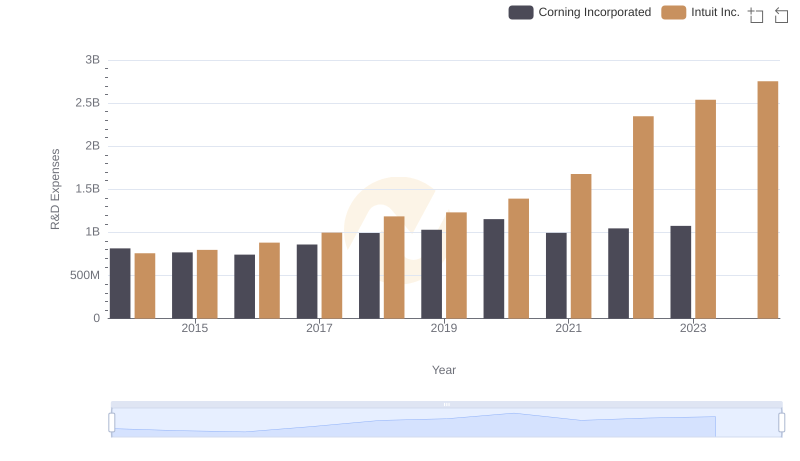
Analyzing R&D Budgets: Intuit Inc. vs Corning Incorporated
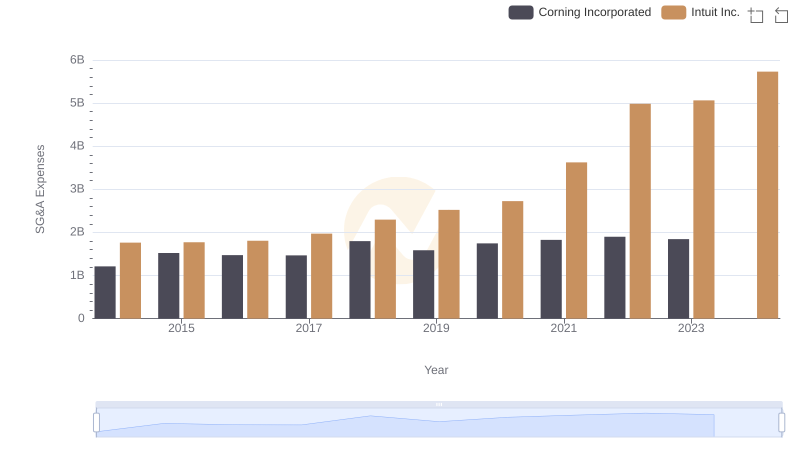
Selling, General, and Administrative Costs: Intuit Inc. vs Corning Incorporated
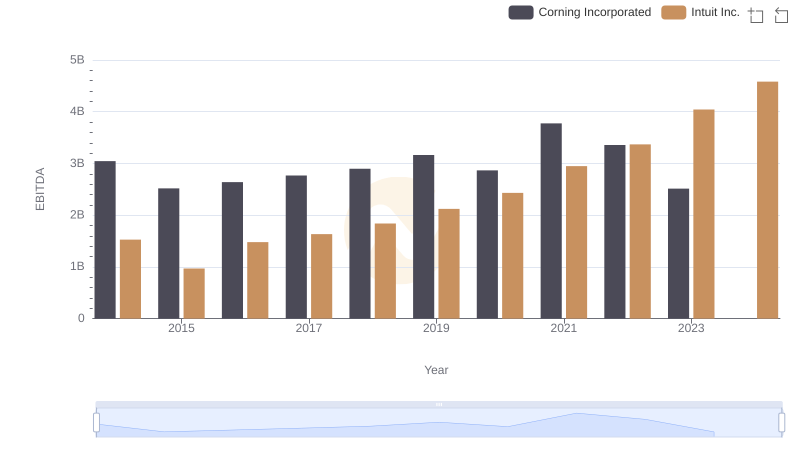
EBITDA Metrics Evaluated: Intuit Inc. vs Corning Incorporated