| __timestamp | Lennox International Inc. | Snap-on Incorporated |
|---|---|---|
| Wednesday, January 1, 2014 | 387700000 | 767600000 |
| Thursday, January 1, 2015 | 423600000 | 848900000 |
| Friday, January 1, 2016 | 490800000 | 942400000 |
| Sunday, January 1, 2017 | 562900000 | 971900000 |
| Monday, January 1, 2018 | 575200000 | 1057400000 |
| Tuesday, January 1, 2019 | 633300000 | 1067000000 |
| Wednesday, January 1, 2020 | 553900000 | 991400000 |
| Friday, January 1, 2021 | 652500000 | 1249100000 |
| Saturday, January 1, 2022 | 729000000 | 1351500000 |
| Sunday, January 1, 2023 | 879500000 | 1478800000 |
| Monday, January 1, 2024 | 1034800000 | 1520700000 |
Unleashing insights
In the ever-evolving landscape of industrial manufacturing, Lennox International Inc. and Snap-on Incorporated have emerged as key players, showcasing impressive EBITDA growth over the past decade. From 2014 to 2023, Lennox International Inc. has seen its EBITDA nearly triple, reflecting a robust growth trajectory. Starting at approximately 388 million in 2014, it soared to over 1 billion by 2023, marking a remarkable increase of around 167%.
Snap-on Incorporated, on the other hand, has consistently outperformed Lennox in absolute terms, with its EBITDA growing from about 768 million in 2014 to nearly 1.48 billion in 2023, a growth of approximately 92%. This consistent upward trend underscores Snap-on's strategic market positioning and operational efficiency.
While Lennox's data for 2024 remains elusive, the trends suggest a continued upward trajectory for both companies, promising exciting developments in the industrial sector.
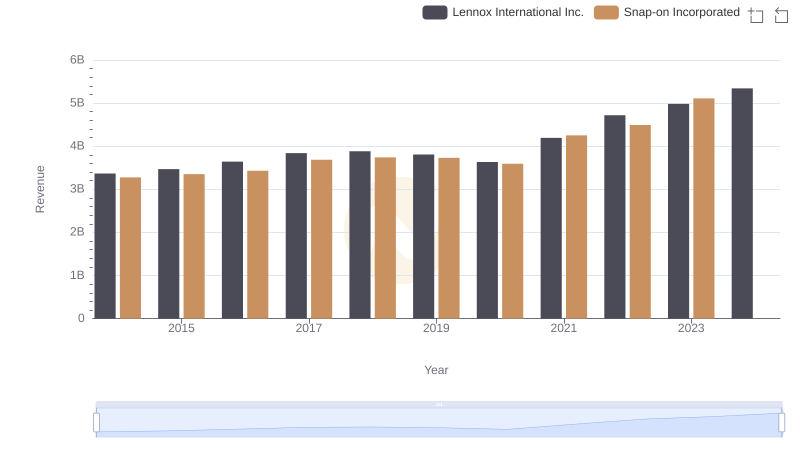
Lennox International Inc. vs Snap-on Incorporated: Examining Key Revenue Metrics
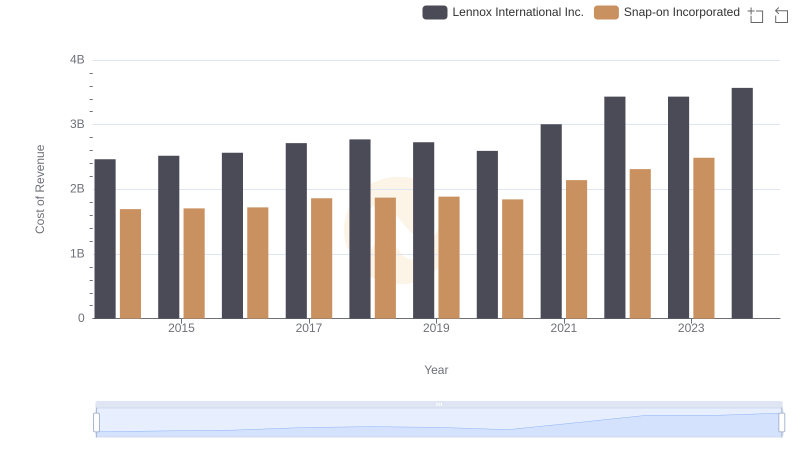
Cost Insights: Breaking Down Lennox International Inc. and Snap-on Incorporated's Expenses
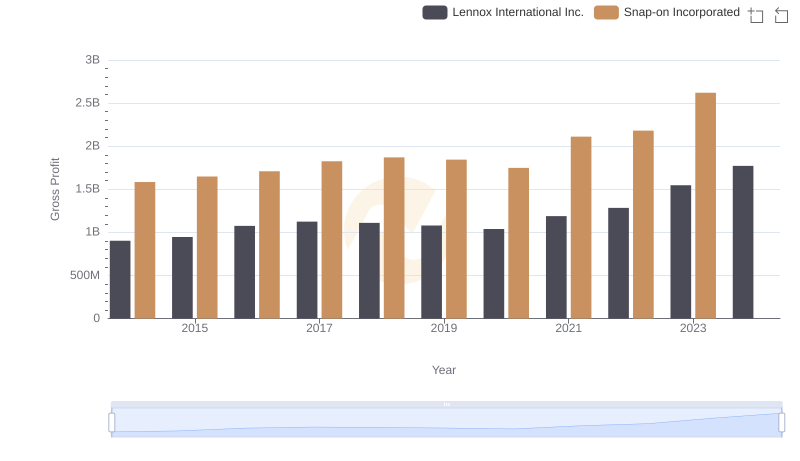
Lennox International Inc. vs Snap-on Incorporated: A Gross Profit Performance Breakdown
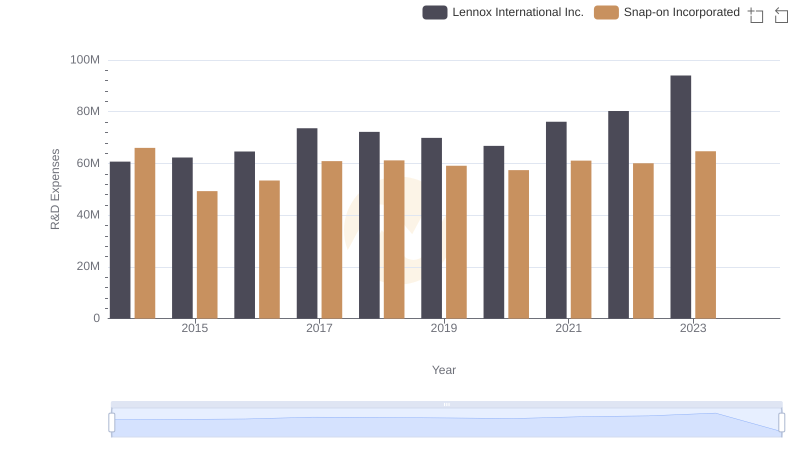
Comparing Innovation Spending: Lennox International Inc. and Snap-on Incorporated

A Professional Review of EBITDA: Lennox International Inc. Compared to Stanley Black & Decker, Inc.
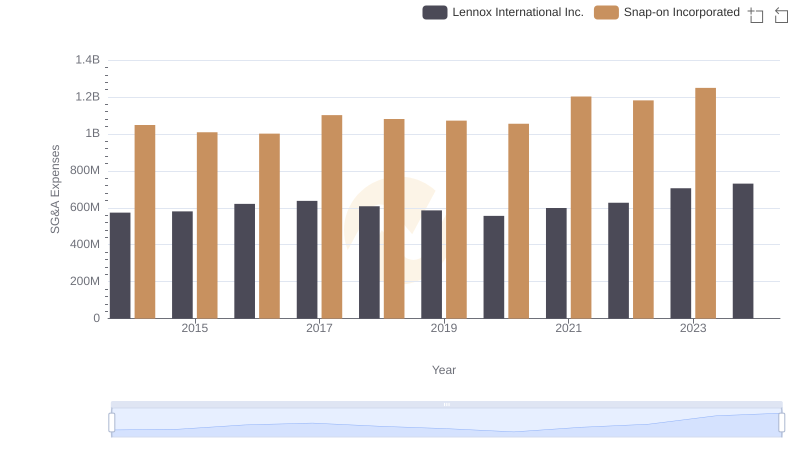
Breaking Down SG&A Expenses: Lennox International Inc. vs Snap-on Incorporated
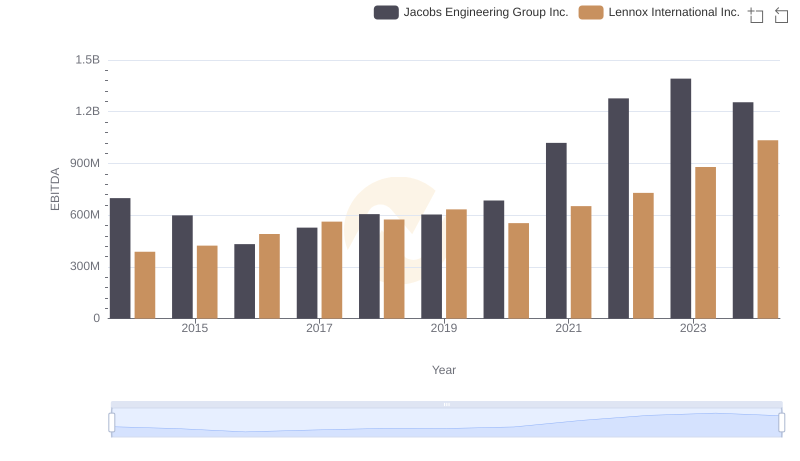
Lennox International Inc. and Jacobs Engineering Group Inc.: A Detailed Examination of EBITDA Performance
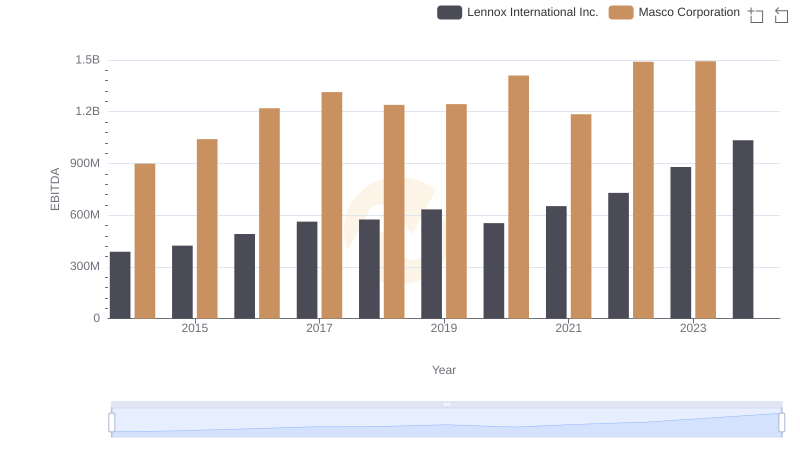
Comprehensive EBITDA Comparison: Lennox International Inc. vs Masco Corporation
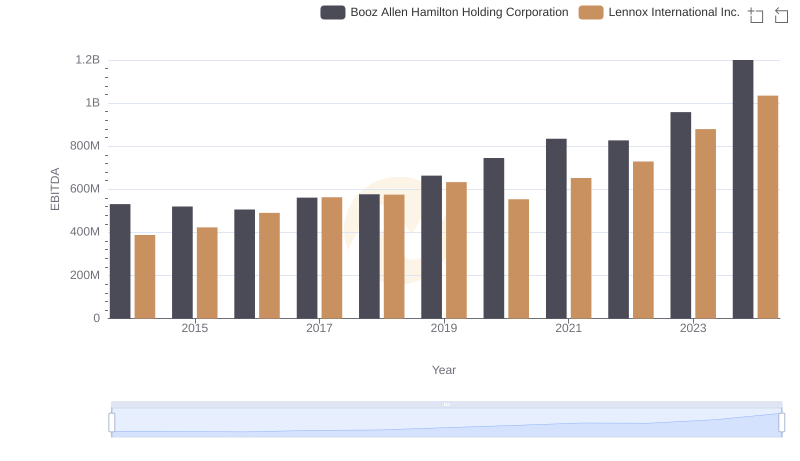
A Side-by-Side Analysis of EBITDA: Lennox International Inc. and Booz Allen Hamilton Holding Corporation
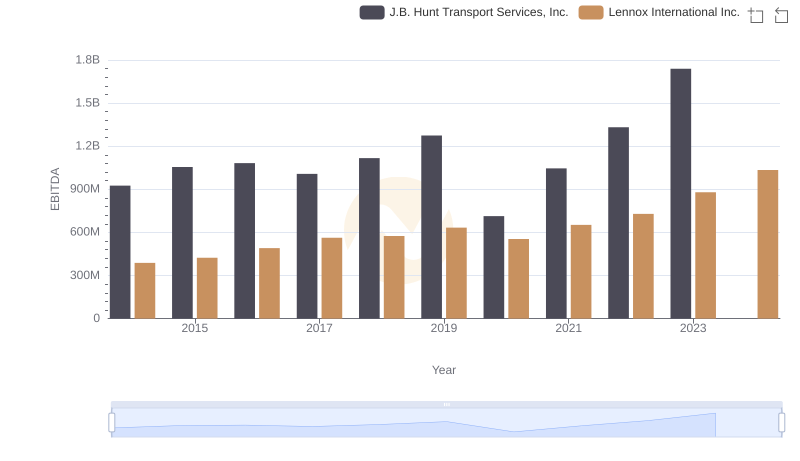
EBITDA Metrics Evaluated: Lennox International Inc. vs J.B. Hunt Transport Services, Inc.
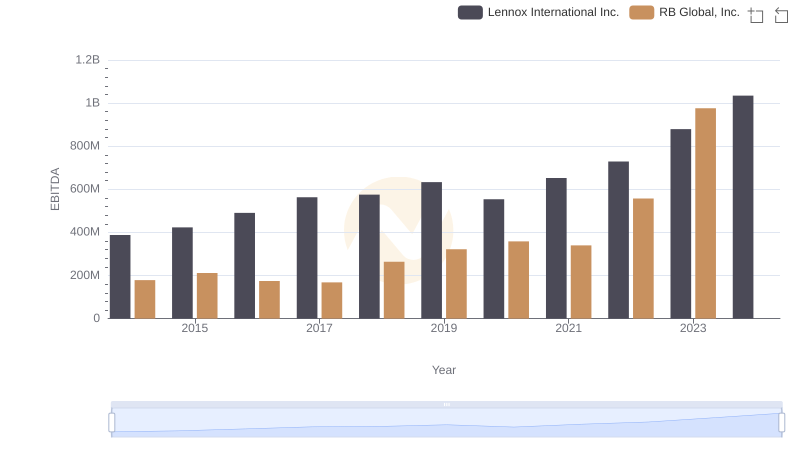
Lennox International Inc. and RB Global, Inc.: A Detailed Examination of EBITDA Performance
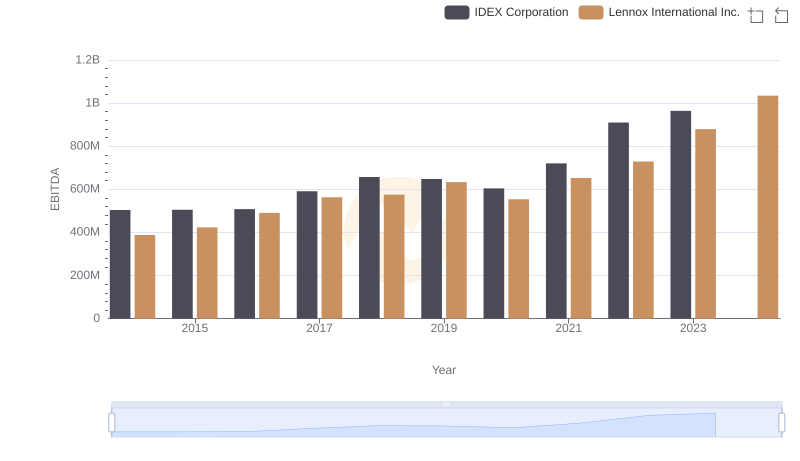
A Professional Review of EBITDA: Lennox International Inc. Compared to IDEX Corporation