| __timestamp | Lennox International Inc. | Stanley Black & Decker, Inc. |
|---|---|---|
| Wednesday, January 1, 2014 | 387700000 | 1975400000 |
| Thursday, January 1, 2015 | 423600000 | 1741900000 |
| Friday, January 1, 2016 | 490800000 | 1810200000 |
| Sunday, January 1, 2017 | 562900000 | 2196000000 |
| Monday, January 1, 2018 | 575200000 | 1791200000 |
| Tuesday, January 1, 2019 | 633300000 | 1920600000 |
| Wednesday, January 1, 2020 | 553900000 | 2004200000 |
| Friday, January 1, 2021 | 652500000 | 2345500000 |
| Saturday, January 1, 2022 | 729000000 | 942800000 |
| Sunday, January 1, 2023 | 879500000 | 802700000 |
| Monday, January 1, 2024 | 1034800000 | 286300000 |
Cracking the code
In the ever-evolving landscape of industrial manufacturing, Lennox International Inc. and Stanley Black & Decker, Inc. have emerged as key players. Over the past decade, Lennox has shown a remarkable growth trajectory, with its EBITDA increasing by approximately 167% from 2014 to 2023. In contrast, Stanley Black & Decker experienced a more volatile journey, peaking in 2021 with an EBITDA of 2.35 billion before a significant drop in subsequent years.
This analysis underscores the dynamic nature of the industry and the importance of strategic adaptability.

Lennox International Inc. vs Stanley Black & Decker, Inc.: Annual Revenue Growth Compared
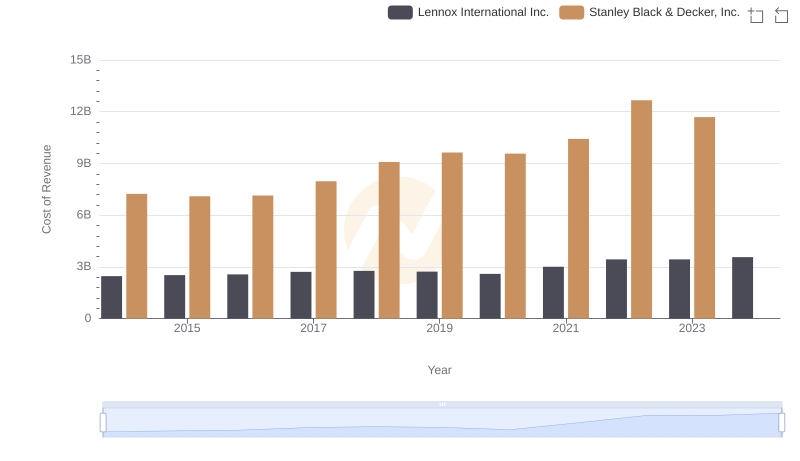
Lennox International Inc. vs Stanley Black & Decker, Inc.: Efficiency in Cost of Revenue Explored

Key Insights on Gross Profit: Lennox International Inc. vs Stanley Black & Decker, Inc.
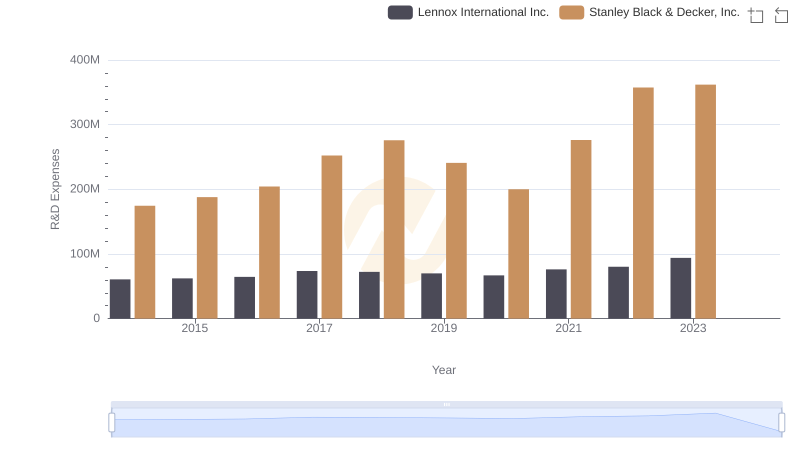
Research and Development Expenses Breakdown: Lennox International Inc. vs Stanley Black & Decker, Inc.
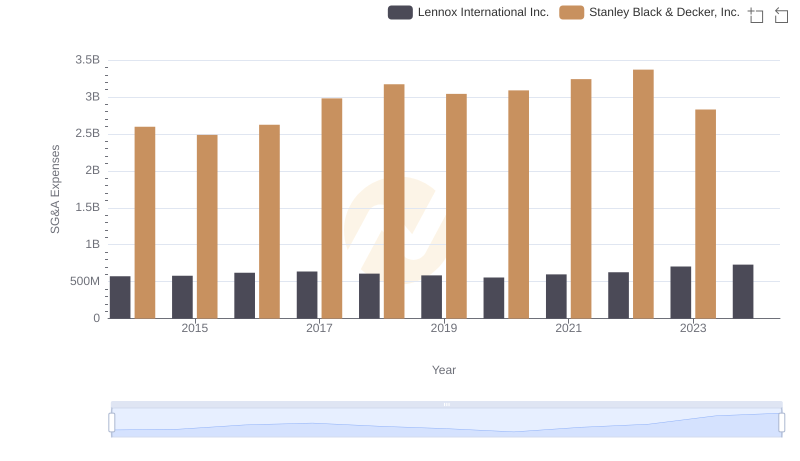
Who Optimizes SG&A Costs Better? Lennox International Inc. or Stanley Black & Decker, Inc.
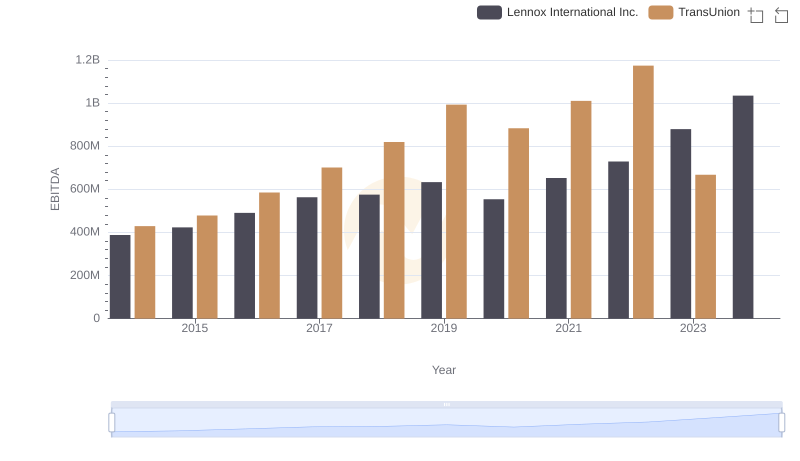
EBITDA Performance Review: Lennox International Inc. vs TransUnion
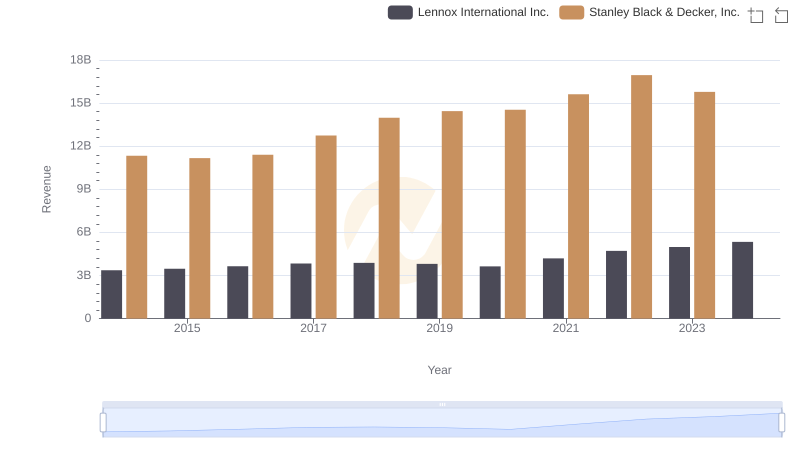
Lennox International Inc. and Stanley Black & Decker, Inc.: A Comprehensive Revenue Analysis

Analyzing Cost of Revenue: Lennox International Inc. and Stanley Black & Decker, Inc.
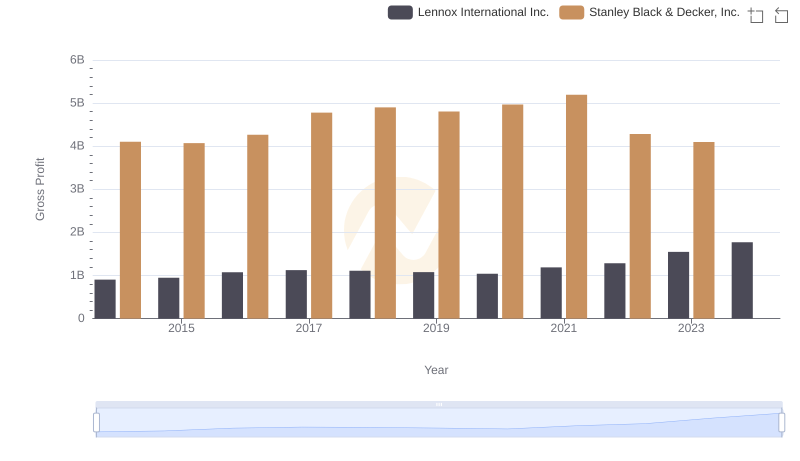
Lennox International Inc. vs Stanley Black & Decker, Inc.: A Gross Profit Performance Breakdown

Research and Development: Comparing Key Metrics for Lennox International Inc. and Stanley Black & Decker, Inc.

Comparing SG&A Expenses: Lennox International Inc. vs Stanley Black & Decker, Inc. Trends and Insights

Professional EBITDA Benchmarking: Lennox International Inc. vs Stanley Black & Decker, Inc.