| __timestamp | IDEX Corporation | Lennox International Inc. |
|---|---|---|
| Wednesday, January 1, 2014 | 504019000 | 387700000 |
| Thursday, January 1, 2015 | 505071000 | 423600000 |
| Friday, January 1, 2016 | 507871000 | 490800000 |
| Sunday, January 1, 2017 | 591033000 | 562900000 |
| Monday, January 1, 2018 | 657092000 | 575200000 |
| Tuesday, January 1, 2019 | 647793000 | 633300000 |
| Wednesday, January 1, 2020 | 604602000 | 553900000 |
| Friday, January 1, 2021 | 720500000 | 652500000 |
| Saturday, January 1, 2022 | 909800000 | 729000000 |
| Sunday, January 1, 2023 | 964100000 | 879500000 |
| Monday, January 1, 2024 | 677200000 | 1034800000 |
Unlocking the unknown
In the ever-evolving landscape of industrial manufacturing, EBITDA serves as a crucial indicator of a company's financial health. Over the past decade, IDEX Corporation and Lennox International Inc. have demonstrated remarkable growth in their EBITDA figures. From 2014 to 2023, IDEX Corporation's EBITDA surged by approximately 91%, peaking in 2023. Meanwhile, Lennox International Inc. experienced a 127% increase, reaching its highest point in 2024.
These trends highlight the resilience and strategic prowess of both companies, making them formidable players in the industrial sector.
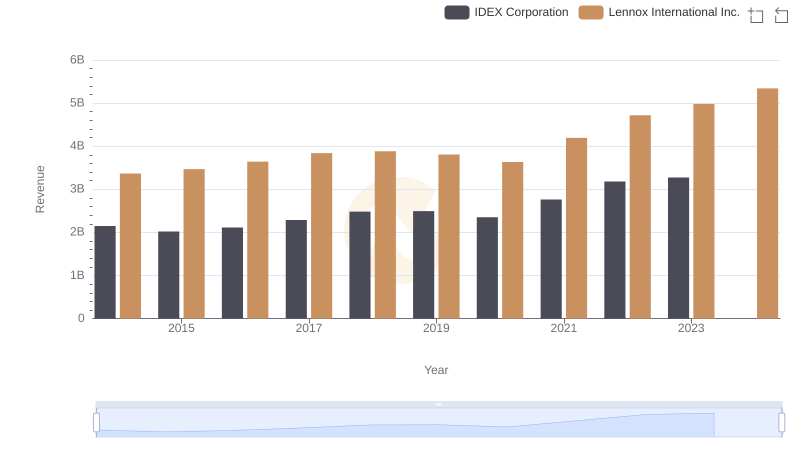
Who Generates More Revenue? Lennox International Inc. or IDEX Corporation
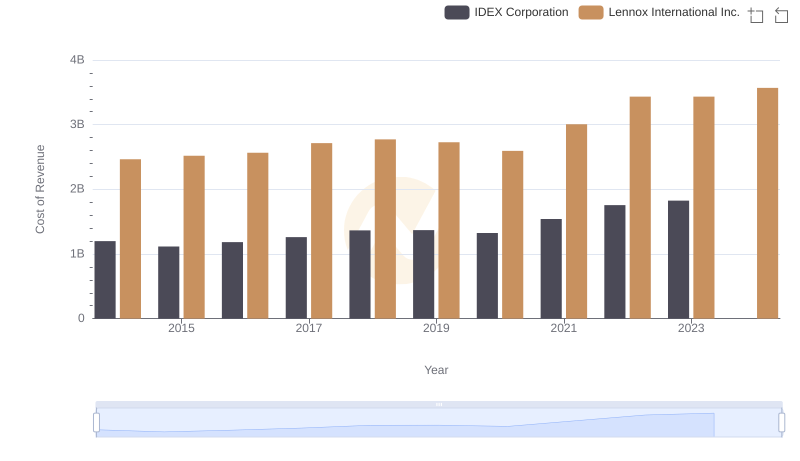
Cost of Revenue Trends: Lennox International Inc. vs IDEX Corporation
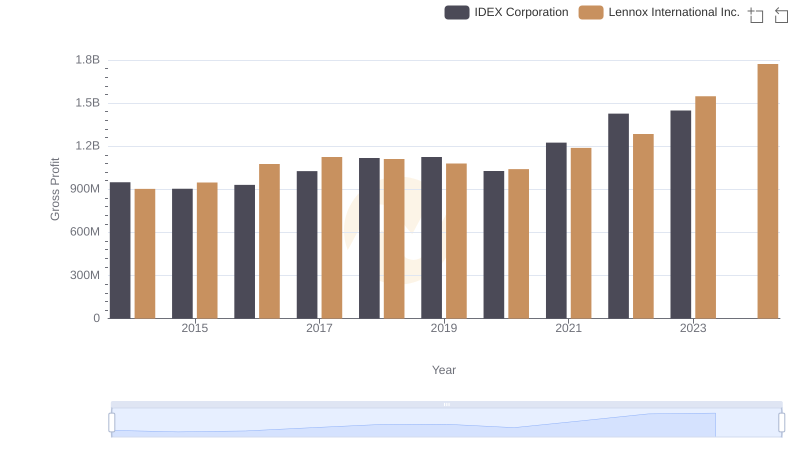
Gross Profit Comparison: Lennox International Inc. and IDEX Corporation Trends
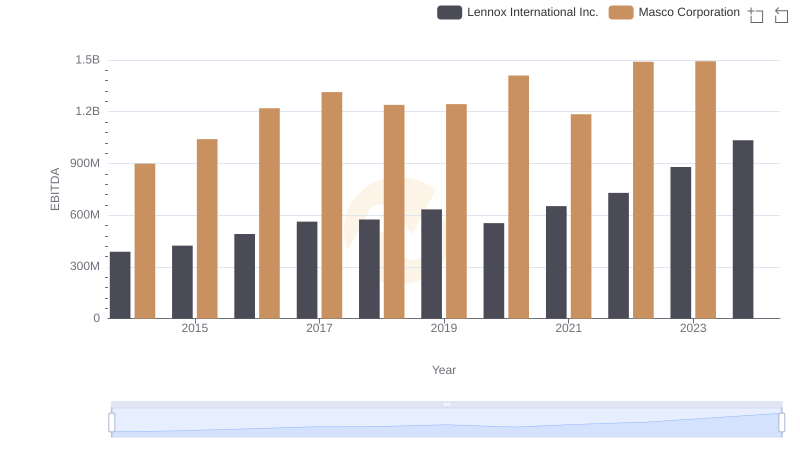
Comprehensive EBITDA Comparison: Lennox International Inc. vs Masco Corporation
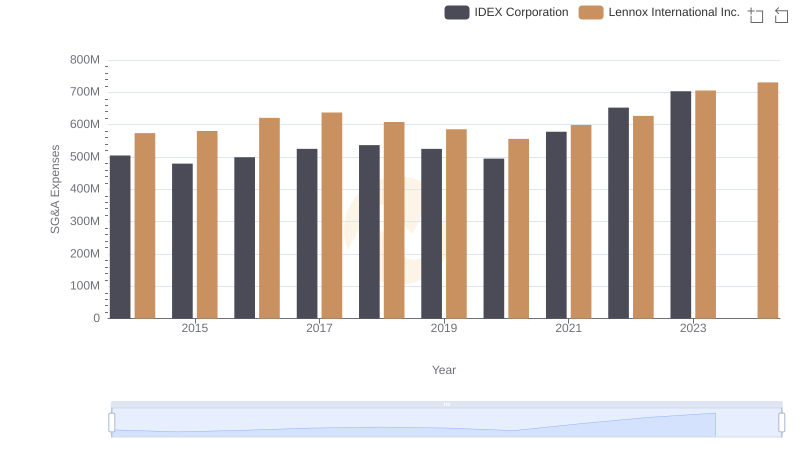
Lennox International Inc. vs IDEX Corporation: SG&A Expense Trends
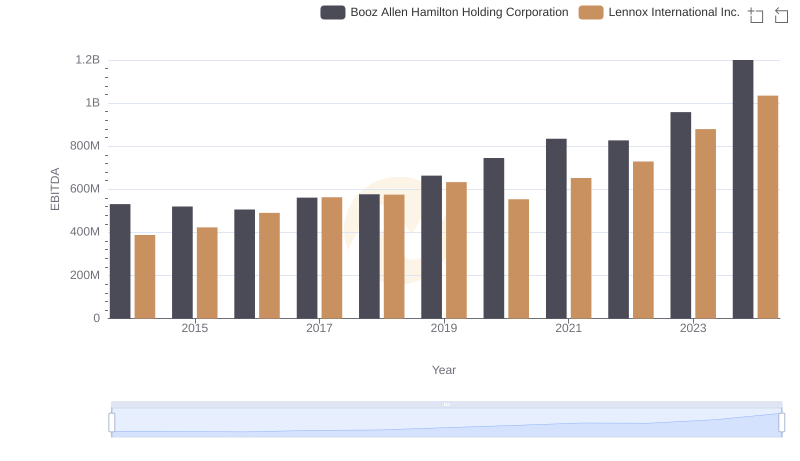
A Side-by-Side Analysis of EBITDA: Lennox International Inc. and Booz Allen Hamilton Holding Corporation
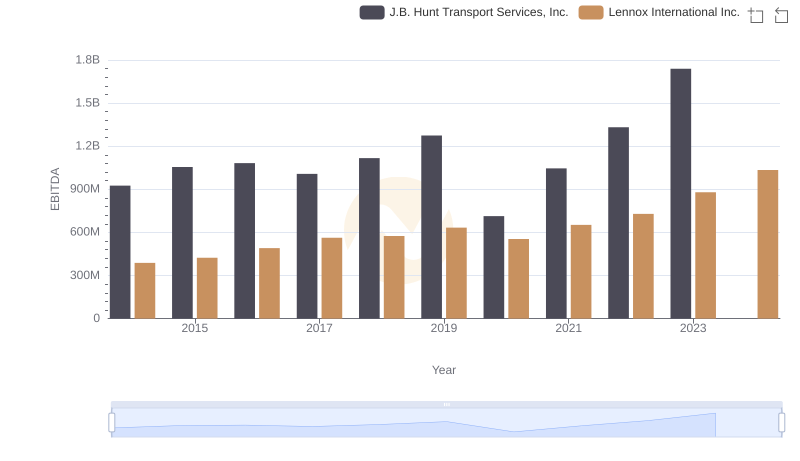
EBITDA Metrics Evaluated: Lennox International Inc. vs J.B. Hunt Transport Services, Inc.
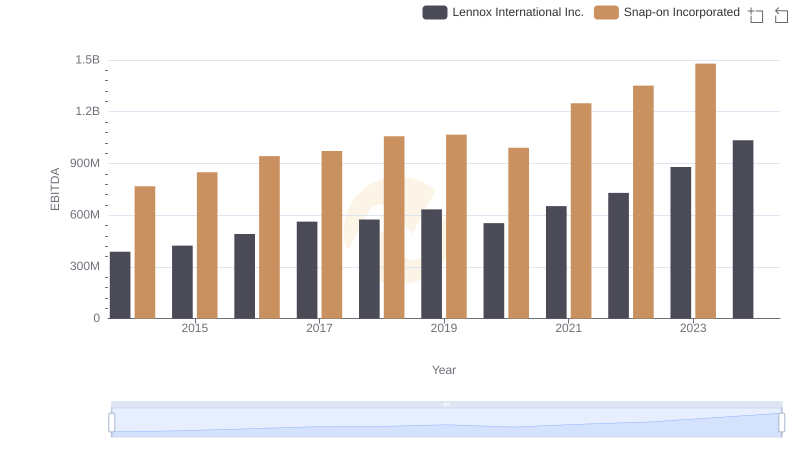
Lennox International Inc. and Snap-on Incorporated: A Detailed Examination of EBITDA Performance
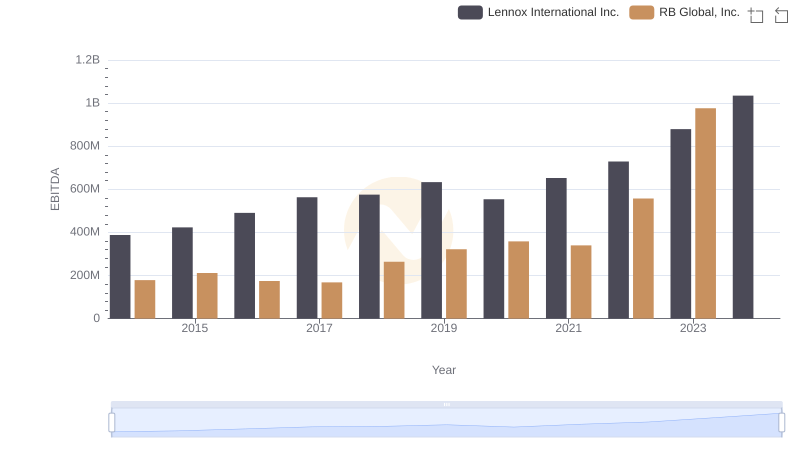
Lennox International Inc. and RB Global, Inc.: A Detailed Examination of EBITDA Performance
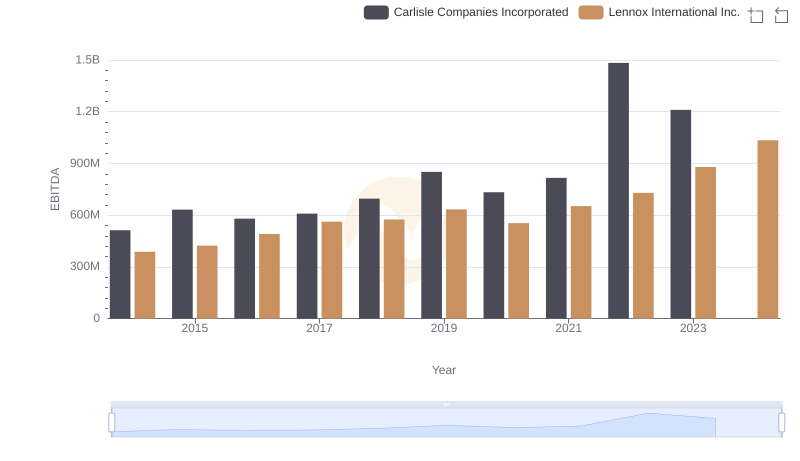
A Side-by-Side Analysis of EBITDA: Lennox International Inc. and Carlisle Companies Incorporated
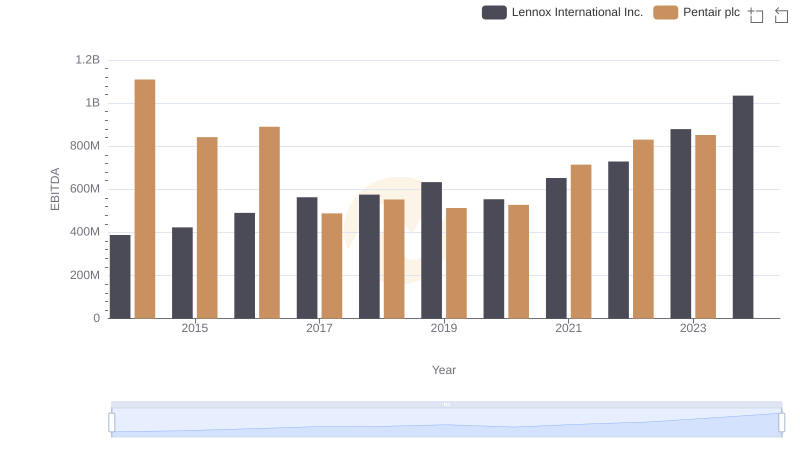
Comparative EBITDA Analysis: Lennox International Inc. vs Pentair plc
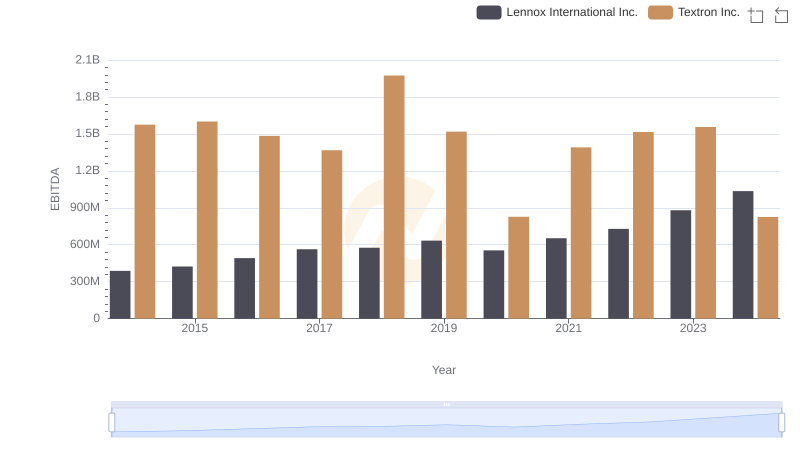
EBITDA Performance Review: Lennox International Inc. vs Textron Inc.