| __timestamp | Lennox International Inc. | Masco Corporation |
|---|---|---|
| Wednesday, January 1, 2014 | 387700000 | 899000000 |
| Thursday, January 1, 2015 | 423600000 | 1041000000 |
| Friday, January 1, 2016 | 490800000 | 1220000000 |
| Sunday, January 1, 2017 | 562900000 | 1314000000 |
| Monday, January 1, 2018 | 575200000 | 1240000000 |
| Tuesday, January 1, 2019 | 633300000 | 1244000000 |
| Wednesday, January 1, 2020 | 553900000 | 1410000000 |
| Friday, January 1, 2021 | 652500000 | 1185000000 |
| Saturday, January 1, 2022 | 729000000 | 1490000000 |
| Sunday, January 1, 2023 | 879500000 | 1493000000 |
| Monday, January 1, 2024 | 1034800000 | 1410000000 |
Cracking the code
In the ever-evolving landscape of the HVAC and home improvement sectors, Lennox International Inc. and Masco Corporation have been pivotal players. From 2014 to 2023, these industry giants have showcased remarkable growth in their EBITDA, a key indicator of financial health. Lennox International Inc. has seen its EBITDA surge by approximately 167%, starting from 388 million in 2014 to an impressive 1.035 billion in 2023. Meanwhile, Masco Corporation has consistently outperformed, with its EBITDA peaking at 1.493 billion in 2023, reflecting a robust 66% increase from 2014.
While Lennox's growth trajectory is steeper, Masco's larger EBITDA base underscores its dominant market position. However, the absence of 2024 data for Masco leaves room for speculation. As these companies continue to innovate, their financial journeys offer valuable insights into the resilience and adaptability of the home improvement industry.
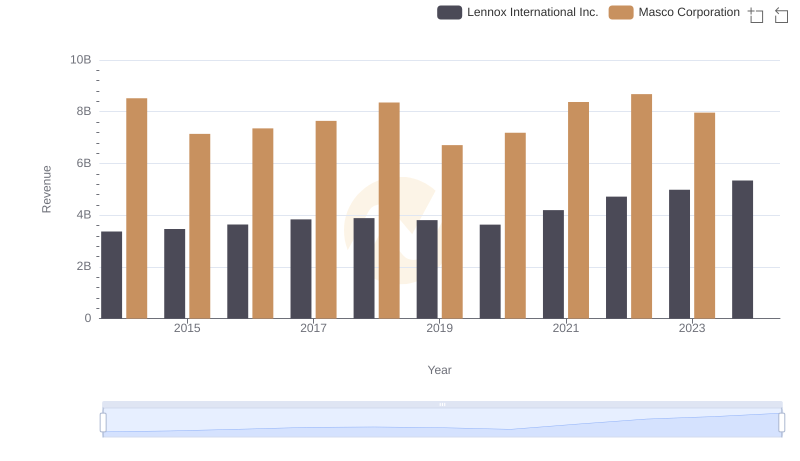
Lennox International Inc. vs Masco Corporation: Annual Revenue Growth Compared
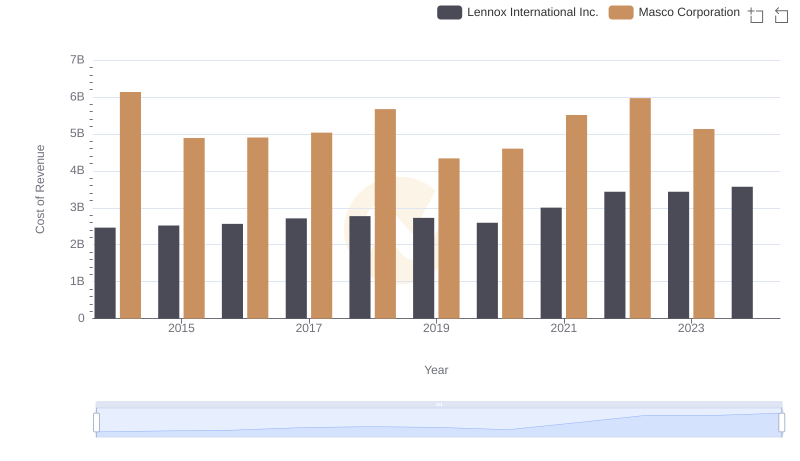
Analyzing Cost of Revenue: Lennox International Inc. and Masco Corporation
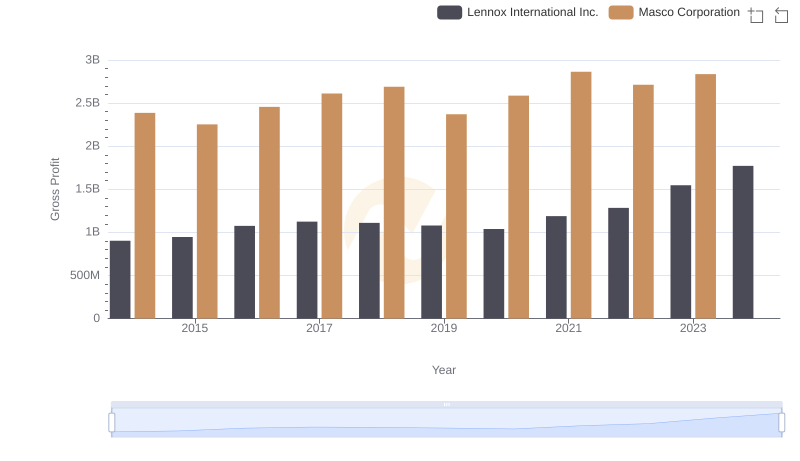
Gross Profit Trends Compared: Lennox International Inc. vs Masco Corporation
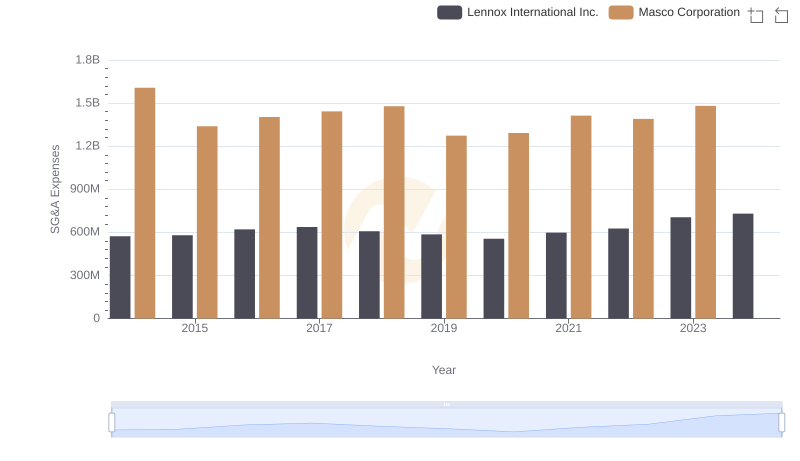
Lennox International Inc. or Masco Corporation: Who Manages SG&A Costs Better?
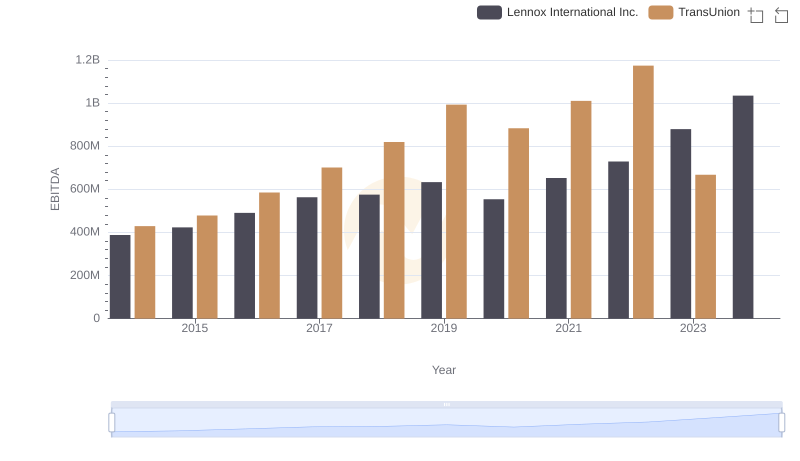
EBITDA Performance Review: Lennox International Inc. vs TransUnion

A Professional Review of EBITDA: Lennox International Inc. Compared to Stanley Black & Decker, Inc.
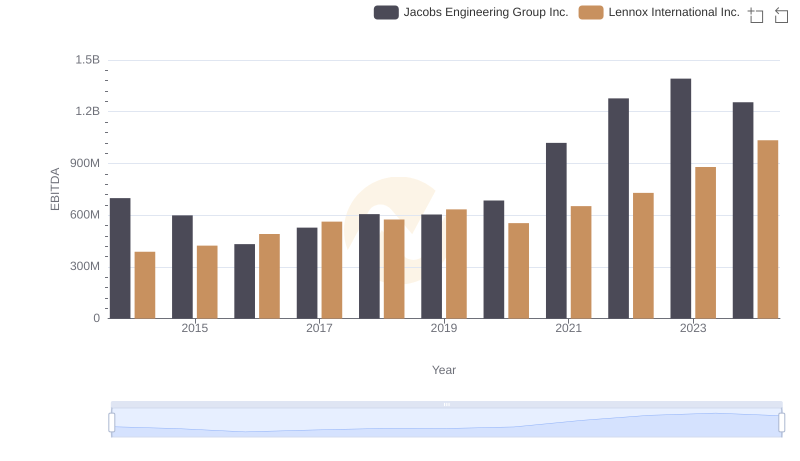
Lennox International Inc. and Jacobs Engineering Group Inc.: A Detailed Examination of EBITDA Performance
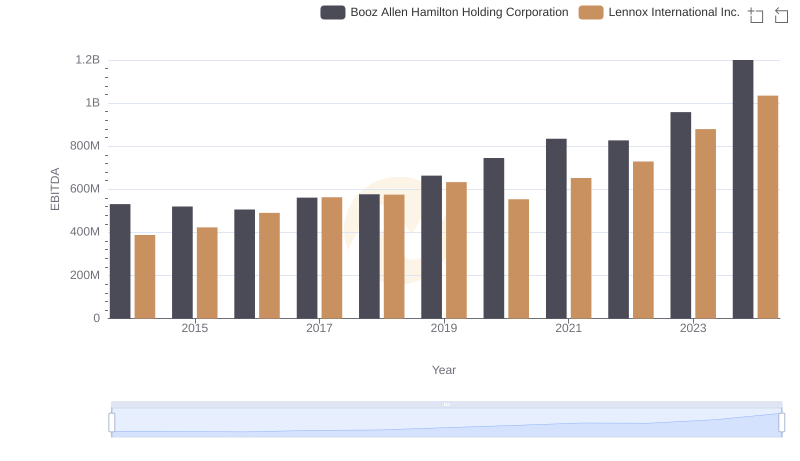
A Side-by-Side Analysis of EBITDA: Lennox International Inc. and Booz Allen Hamilton Holding Corporation
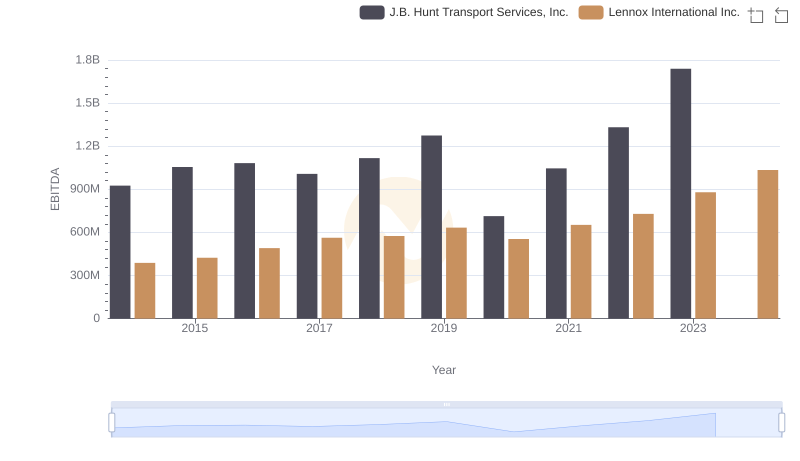
EBITDA Metrics Evaluated: Lennox International Inc. vs J.B. Hunt Transport Services, Inc.
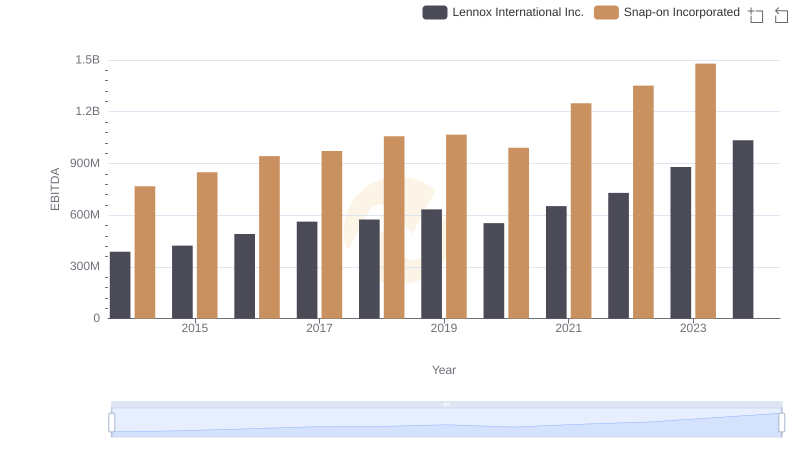
Lennox International Inc. and Snap-on Incorporated: A Detailed Examination of EBITDA Performance
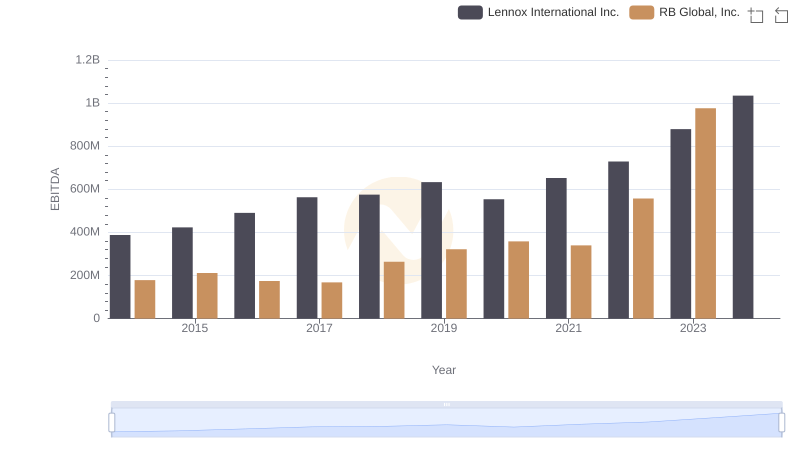
Lennox International Inc. and RB Global, Inc.: A Detailed Examination of EBITDA Performance
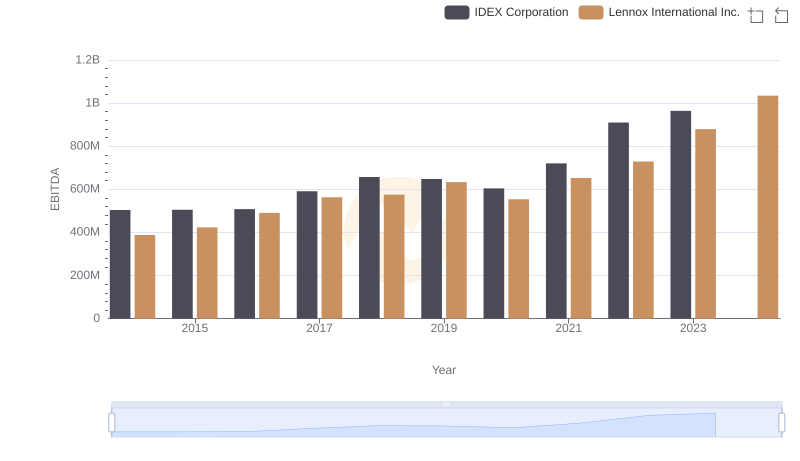
A Professional Review of EBITDA: Lennox International Inc. Compared to IDEX Corporation