| __timestamp | Booz Allen Hamilton Holding Corporation | Lennox International Inc. |
|---|---|---|
| Wednesday, January 1, 2014 | 531144000 | 387700000 |
| Thursday, January 1, 2015 | 520410000 | 423600000 |
| Friday, January 1, 2016 | 506120000 | 490800000 |
| Sunday, January 1, 2017 | 561524000 | 562900000 |
| Monday, January 1, 2018 | 577061000 | 575200000 |
| Tuesday, January 1, 2019 | 663731000 | 633300000 |
| Wednesday, January 1, 2020 | 745424000 | 553900000 |
| Friday, January 1, 2021 | 834449000 | 652500000 |
| Saturday, January 1, 2022 | 826865000 | 729000000 |
| Sunday, January 1, 2023 | 958150000 | 879500000 |
| Monday, January 1, 2024 | 1199992000 | 1034800000 |
In pursuit of knowledge
In the ever-evolving landscape of corporate finance, EBITDA serves as a crucial indicator of a company's operational efficiency. Over the past decade, Booz Allen Hamilton Holding Corporation and Lennox International Inc. have demonstrated remarkable growth in this metric. From 2014 to 2024, Booz Allen Hamilton's EBITDA surged by approximately 126%, while Lennox International saw an impressive 167% increase.
Booz Allen Hamilton's EBITDA growth reflects its strategic expansion and adaptation to market demands, particularly in the technology and consulting sectors. Meanwhile, Lennox International's robust performance underscores its resilience and innovation in the HVAC industry. Notably, both companies experienced significant growth post-2020, with Booz Allen Hamilton's EBITDA peaking at nearly 1.2 billion in 2024, and Lennox International reaching over 1 billion. This side-by-side analysis highlights the dynamic nature of these industries and the companies' ability to thrive amidst economic challenges.
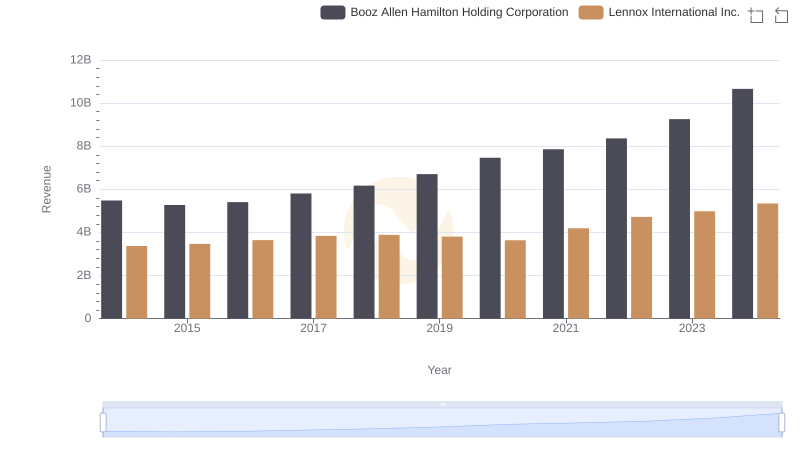
Comparing Revenue Performance: Lennox International Inc. or Booz Allen Hamilton Holding Corporation?
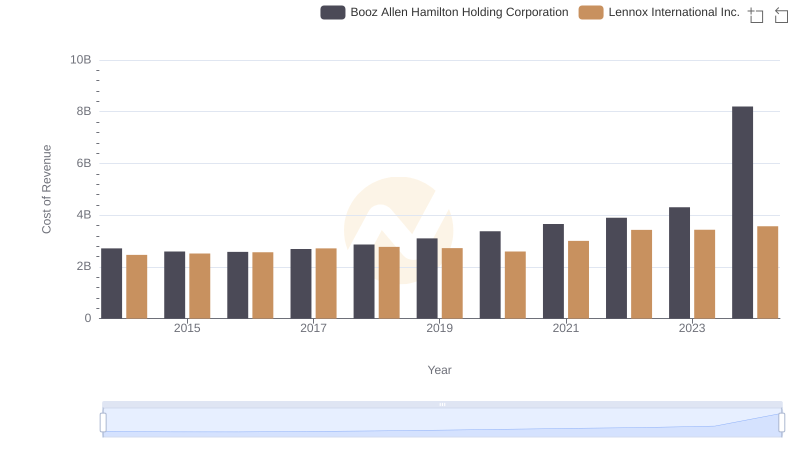
Analyzing Cost of Revenue: Lennox International Inc. and Booz Allen Hamilton Holding Corporation
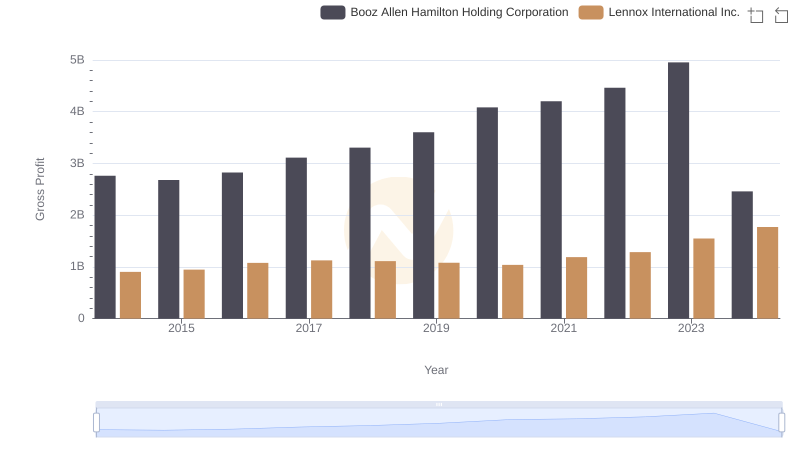
Gross Profit Trends Compared: Lennox International Inc. vs Booz Allen Hamilton Holding Corporation
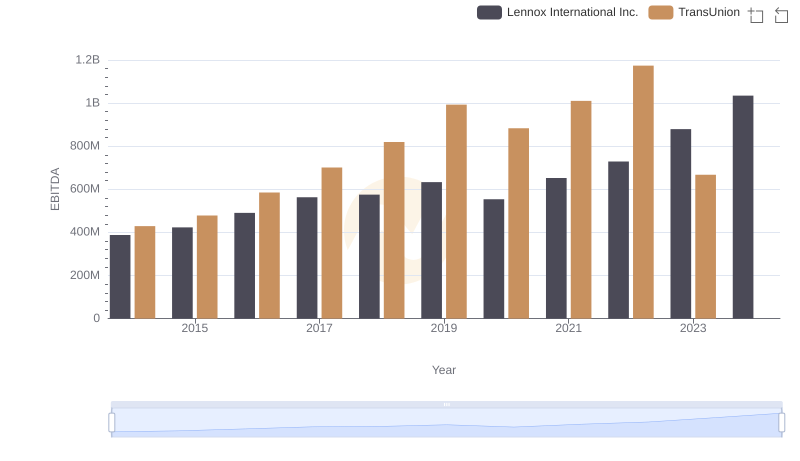
EBITDA Performance Review: Lennox International Inc. vs TransUnion

A Professional Review of EBITDA: Lennox International Inc. Compared to Stanley Black & Decker, Inc.
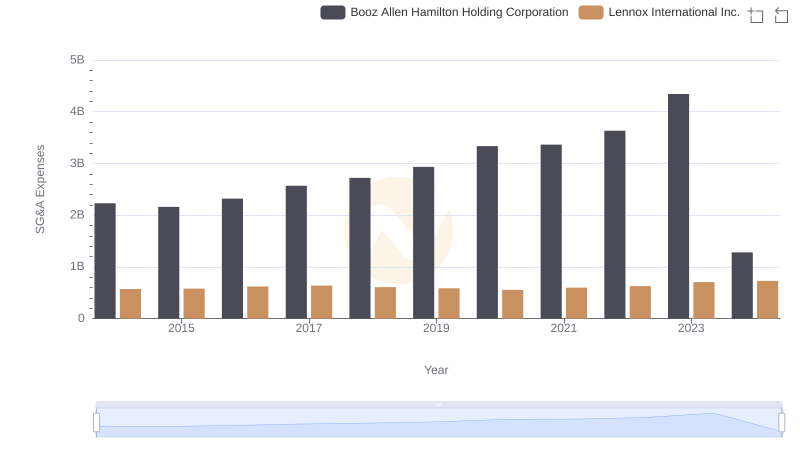
Selling, General, and Administrative Costs: Lennox International Inc. vs Booz Allen Hamilton Holding Corporation
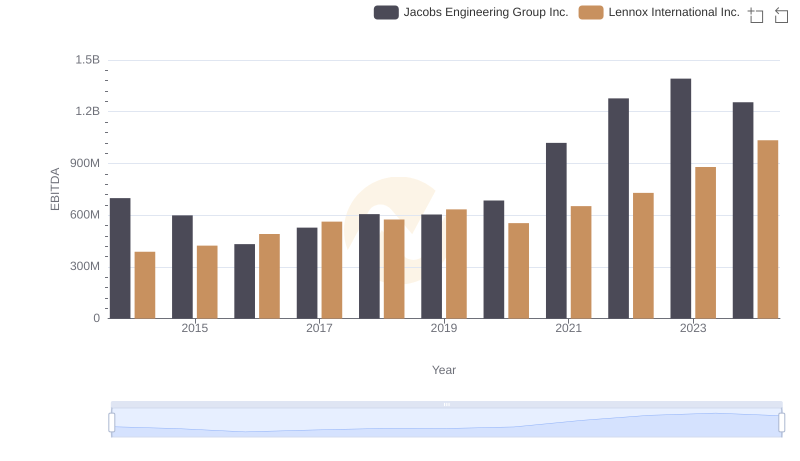
Lennox International Inc. and Jacobs Engineering Group Inc.: A Detailed Examination of EBITDA Performance
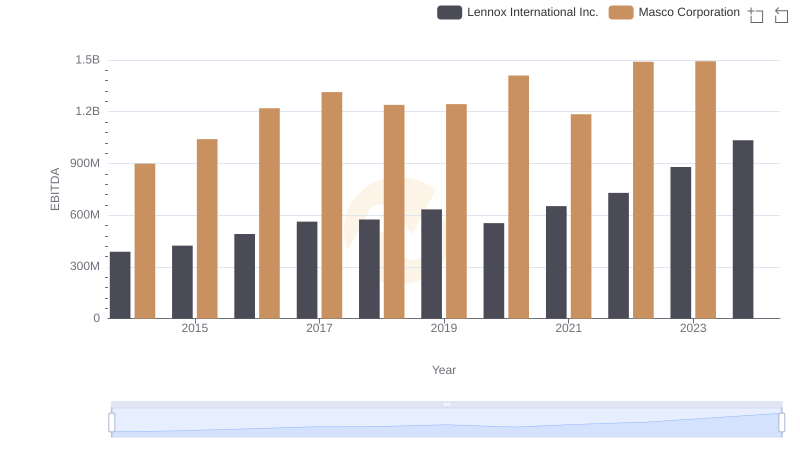
Comprehensive EBITDA Comparison: Lennox International Inc. vs Masco Corporation
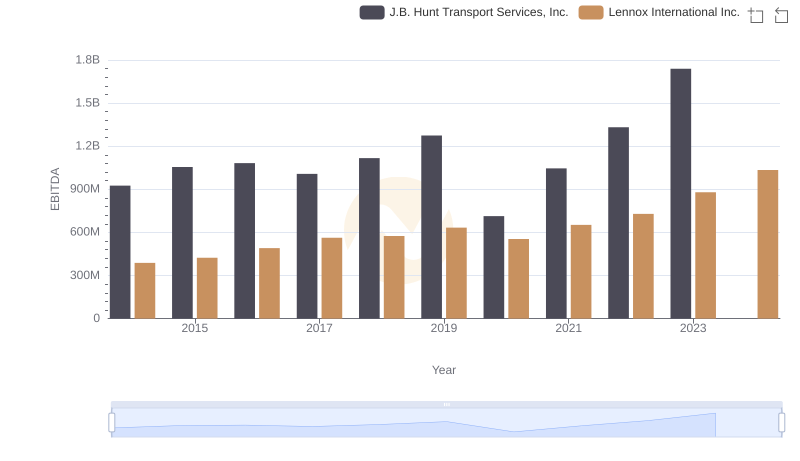
EBITDA Metrics Evaluated: Lennox International Inc. vs J.B. Hunt Transport Services, Inc.
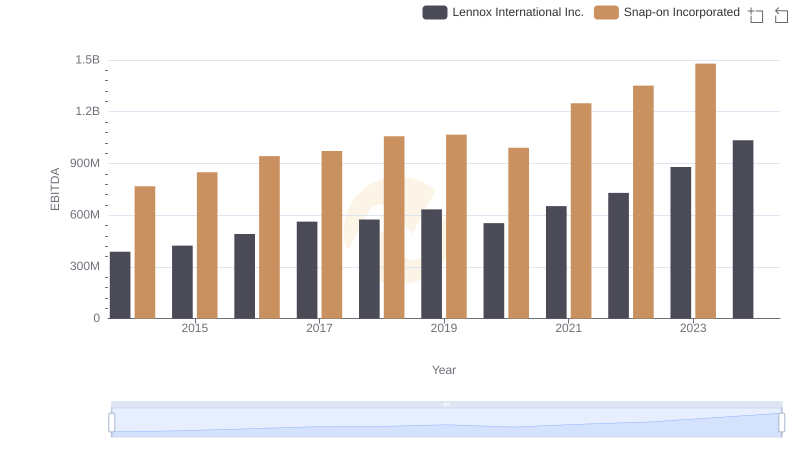
Lennox International Inc. and Snap-on Incorporated: A Detailed Examination of EBITDA Performance
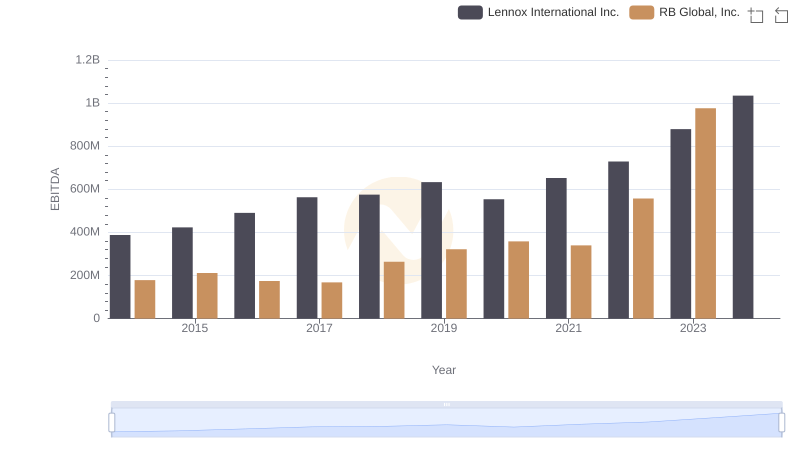
Lennox International Inc. and RB Global, Inc.: A Detailed Examination of EBITDA Performance
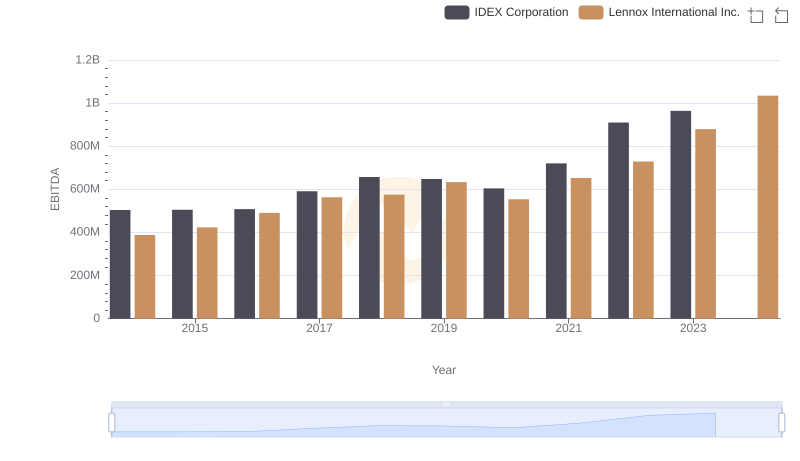
A Professional Review of EBITDA: Lennox International Inc. Compared to IDEX Corporation