| __timestamp | Lennox International Inc. | Snap-on Incorporated |
|---|---|---|
| Wednesday, January 1, 2014 | 3367400000 | 3277700000 |
| Thursday, January 1, 2015 | 3467400000 | 3352800000 |
| Friday, January 1, 2016 | 3641600000 | 3430400000 |
| Sunday, January 1, 2017 | 3839600000 | 3686900000 |
| Monday, January 1, 2018 | 3883900000 | 3740700000 |
| Tuesday, January 1, 2019 | 3807200000 | 3730000000 |
| Wednesday, January 1, 2020 | 3634100000 | 3592500000 |
| Friday, January 1, 2021 | 4194100000 | 4252000000 |
| Saturday, January 1, 2022 | 4718400000 | 4492800000 |
| Sunday, January 1, 2023 | 4981900000 | 5108300000 |
| Monday, January 1, 2024 | 5341300000 | 4707400000 |
Infusing magic into the data realm
In the ever-evolving landscape of industrial manufacturing, Lennox International Inc. and Snap-on Incorporated have demonstrated remarkable revenue trajectories over the past decade. From 2014 to 2023, Lennox International Inc. saw its revenue grow by approximately 59%, starting from $3.37 billion and reaching $5.34 billion. This consistent upward trend highlights Lennox's strategic market positioning and resilience.
Snap-on Incorporated, a leader in professional tools, also showcased impressive growth, with revenues increasing by around 56% from $3.28 billion in 2014 to $5.11 billion in 2023. Notably, Snap-on surpassed Lennox in 2023, marking a significant milestone in its financial journey.
While both companies faced challenges, including a dip in 2020 due to global disruptions, their recovery and growth underscore their adaptability and market strength. The data for 2024 remains incomplete, leaving room for speculation on future trends.
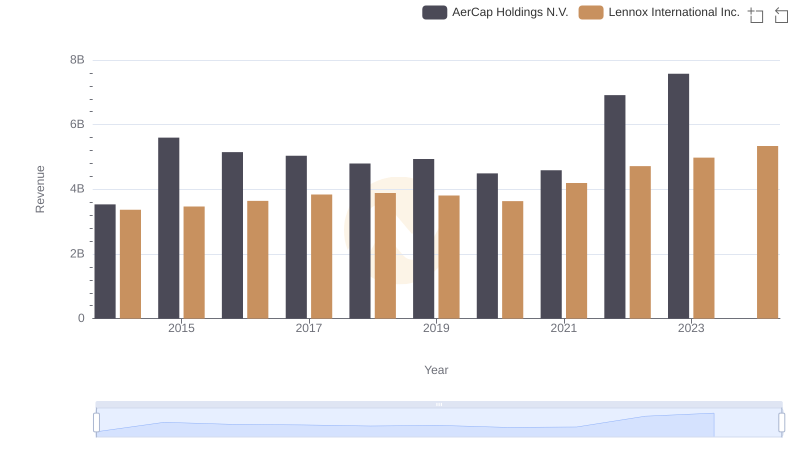
Annual Revenue Comparison: Lennox International Inc. vs AerCap Holdings N.V.
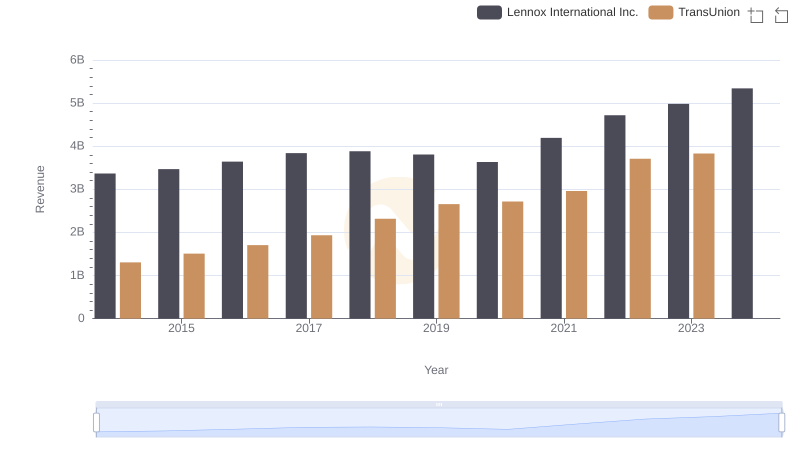
Lennox International Inc. vs TransUnion: Examining Key Revenue Metrics
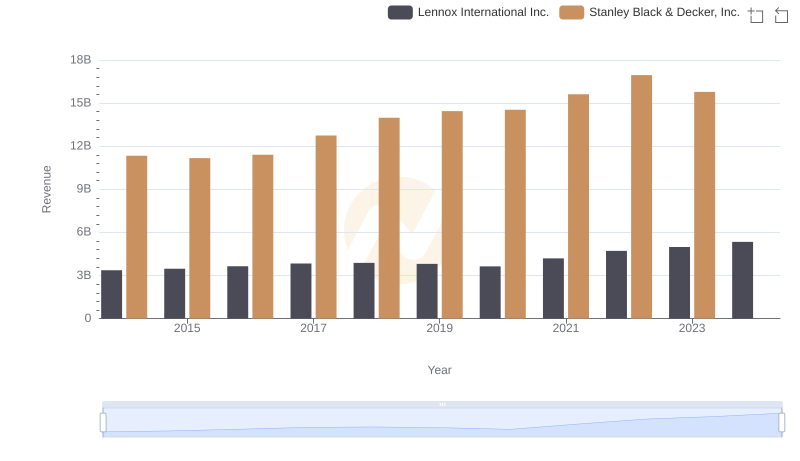
Lennox International Inc. vs Stanley Black & Decker, Inc.: Annual Revenue Growth Compared
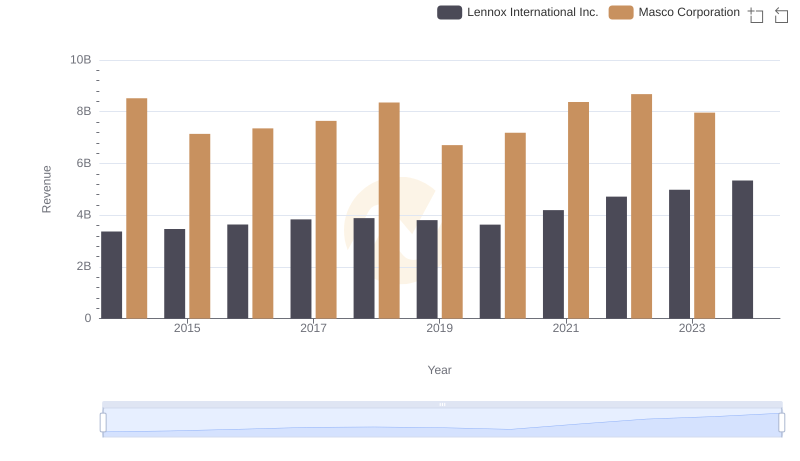
Lennox International Inc. vs Masco Corporation: Annual Revenue Growth Compared
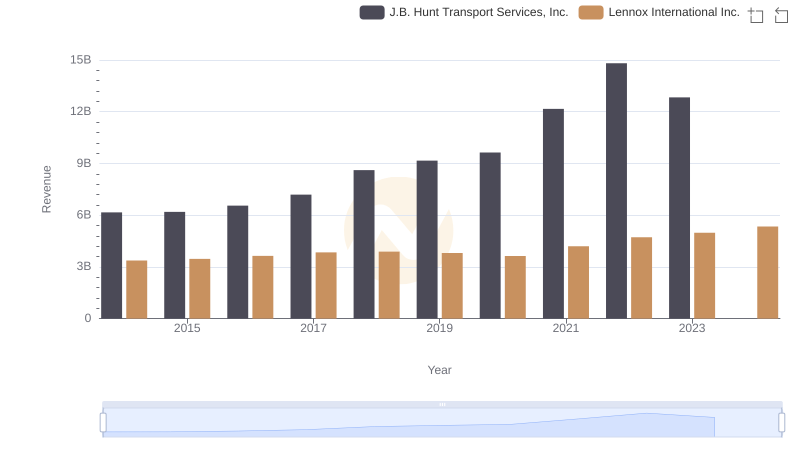
Lennox International Inc. or J.B. Hunt Transport Services, Inc.: Who Leads in Yearly Revenue?
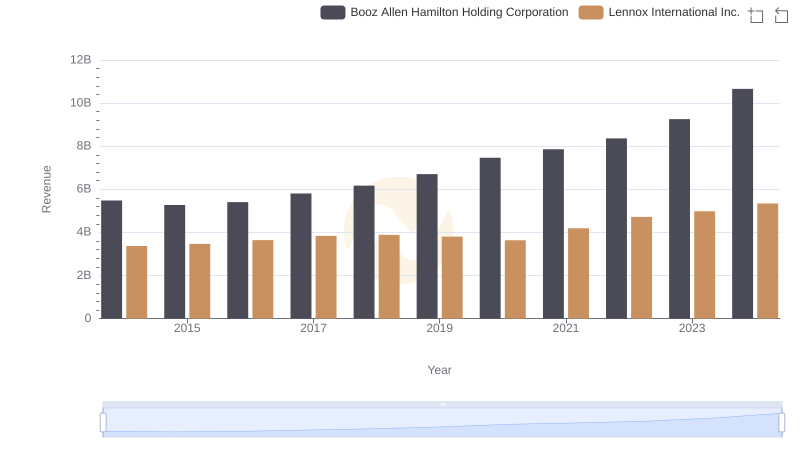
Comparing Revenue Performance: Lennox International Inc. or Booz Allen Hamilton Holding Corporation?
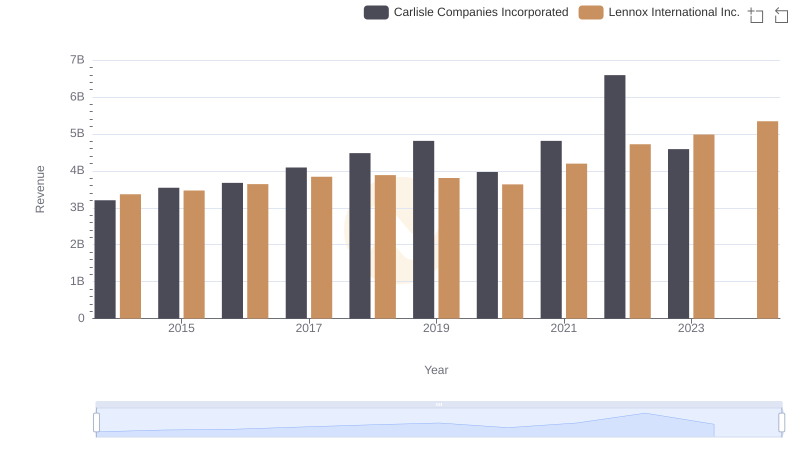
Lennox International Inc. or Carlisle Companies Incorporated: Who Leads in Yearly Revenue?
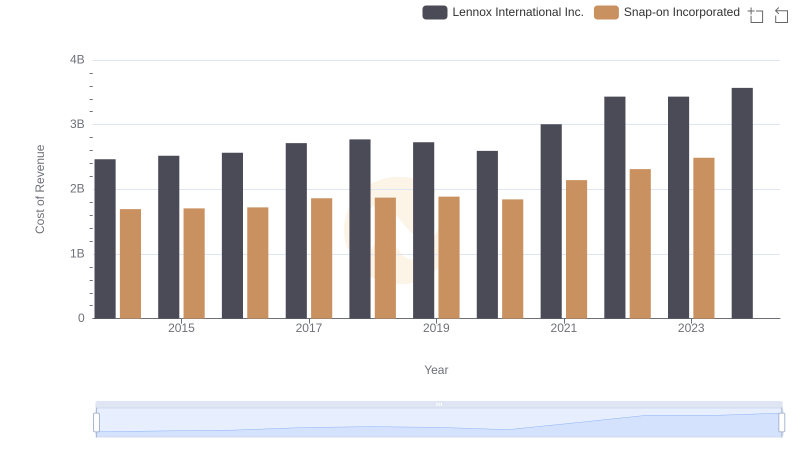
Cost Insights: Breaking Down Lennox International Inc. and Snap-on Incorporated's Expenses
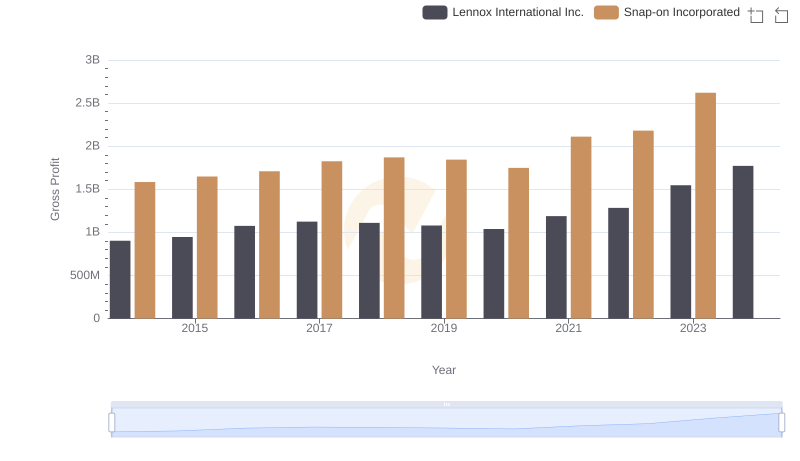
Lennox International Inc. vs Snap-on Incorporated: A Gross Profit Performance Breakdown
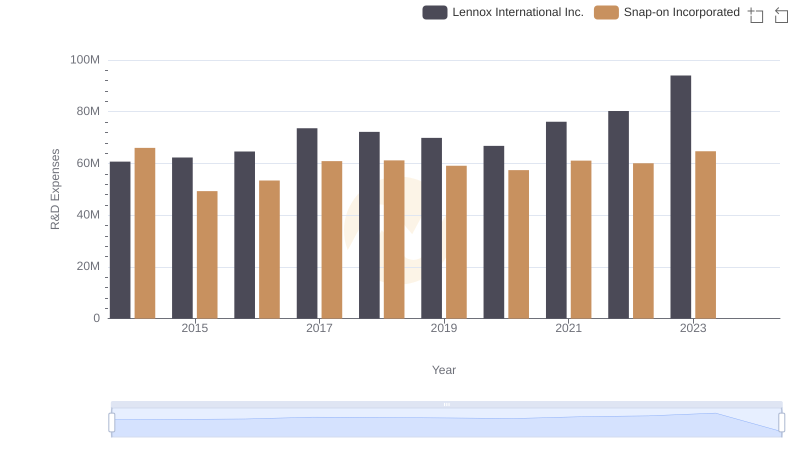
Comparing Innovation Spending: Lennox International Inc. and Snap-on Incorporated
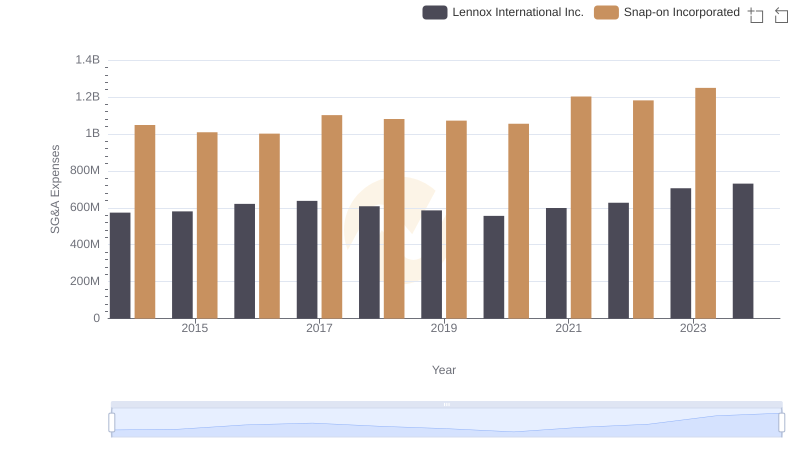
Breaking Down SG&A Expenses: Lennox International Inc. vs Snap-on Incorporated
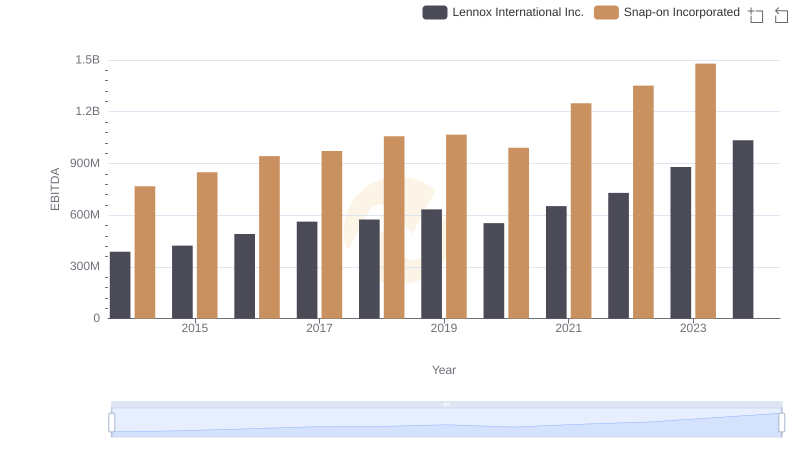
Lennox International Inc. and Snap-on Incorporated: A Detailed Examination of EBITDA Performance