| __timestamp | Jacobs Engineering Group Inc. | Lennox International Inc. |
|---|---|---|
| Wednesday, January 1, 2014 | 699015000 | 387700000 |
| Thursday, January 1, 2015 | 598932000 | 423600000 |
| Friday, January 1, 2016 | 431954000 | 490800000 |
| Sunday, January 1, 2017 | 527765000 | 562900000 |
| Monday, January 1, 2018 | 606328000 | 575200000 |
| Tuesday, January 1, 2019 | 604075000 | 633300000 |
| Wednesday, January 1, 2020 | 685042000 | 553900000 |
| Friday, January 1, 2021 | 1019116000 | 652500000 |
| Saturday, January 1, 2022 | 1277649000 | 729000000 |
| Sunday, January 1, 2023 | 1392039000 | 879500000 |
| Monday, January 1, 2024 | 1255083000 | 1034800000 |
Data in motion
In the ever-evolving landscape of corporate finance, EBITDA (Earnings Before Interest, Taxes, Depreciation, and Amortization) serves as a crucial indicator of a company's operational performance. This analysis delves into the EBITDA trends of Lennox International Inc. and Jacobs Engineering Group Inc. from 2014 to 2024. Over this decade, Jacobs Engineering Group Inc. has demonstrated a robust growth trajectory, with its EBITDA increasing by approximately 99%, peaking in 2023. Meanwhile, Lennox International Inc. has shown a steady rise, with a notable 167% increase, reaching its highest point in 2024. This comparison highlights the resilience and strategic prowess of both companies in navigating market challenges. As we look to the future, these trends offer valuable insights into the financial health and potential growth opportunities for investors and stakeholders alike.
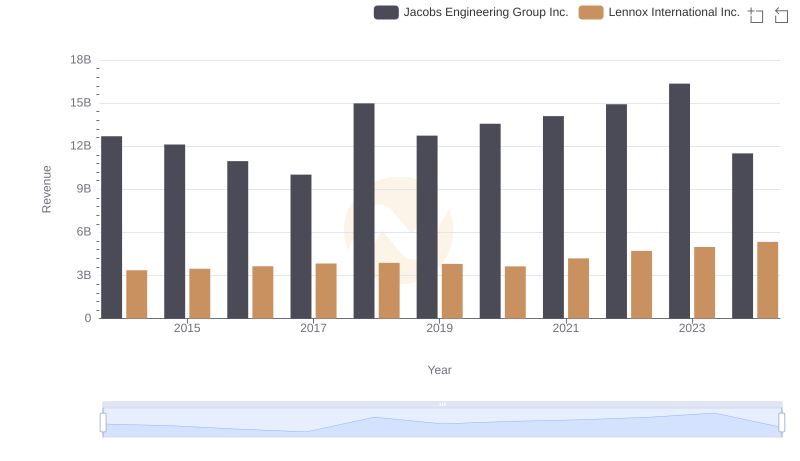
Revenue Showdown: Lennox International Inc. vs Jacobs Engineering Group Inc.
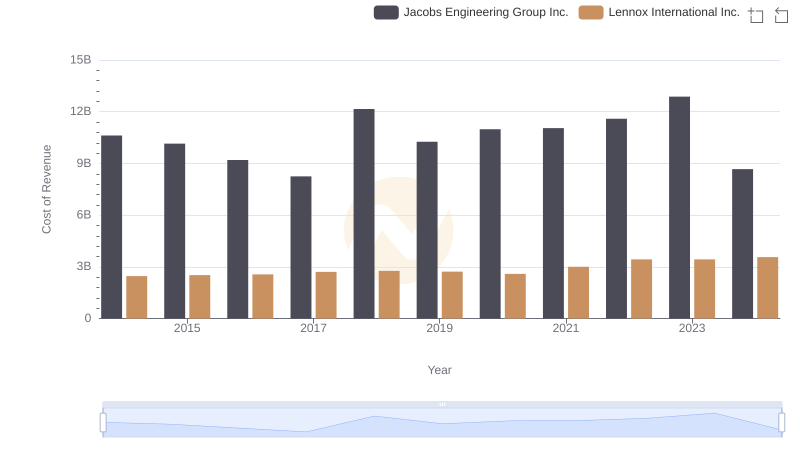
Cost of Revenue Trends: Lennox International Inc. vs Jacobs Engineering Group Inc.
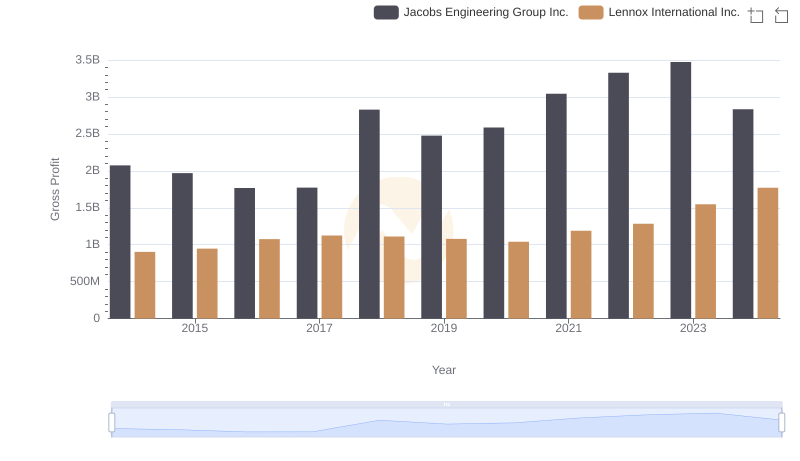
Who Generates Higher Gross Profit? Lennox International Inc. or Jacobs Engineering Group Inc.
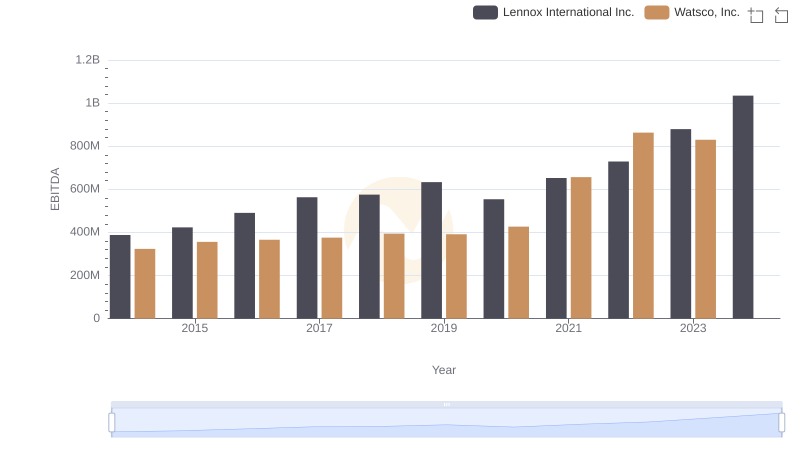
A Professional Review of EBITDA: Lennox International Inc. Compared to Watsco, Inc.
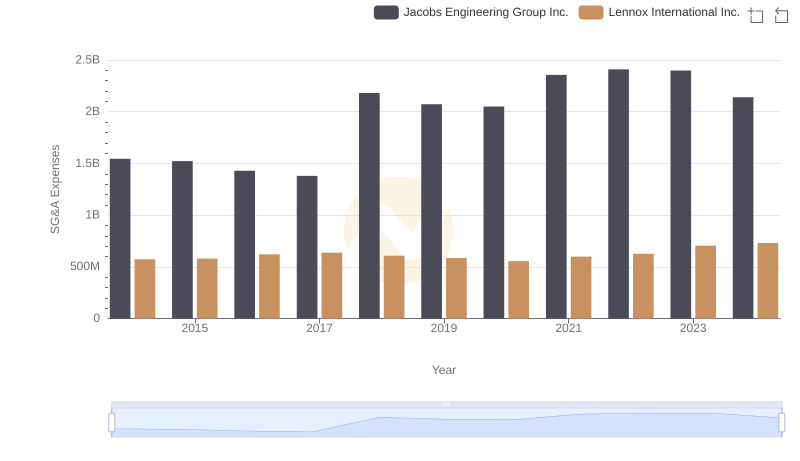
SG&A Efficiency Analysis: Comparing Lennox International Inc. and Jacobs Engineering Group Inc.
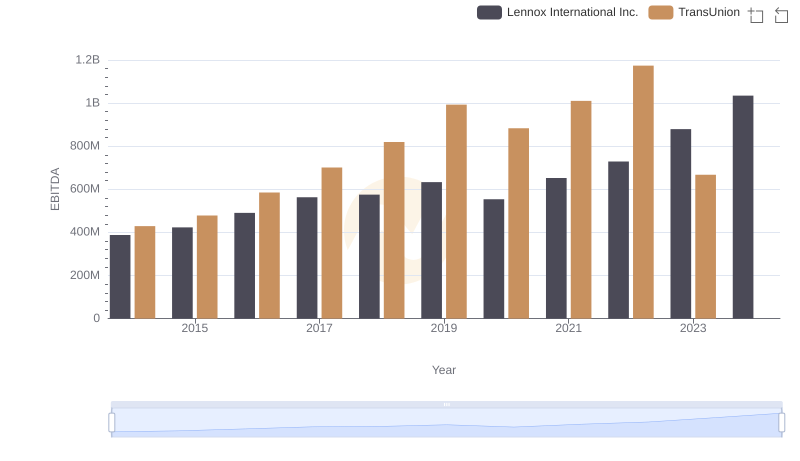
EBITDA Performance Review: Lennox International Inc. vs TransUnion

A Professional Review of EBITDA: Lennox International Inc. Compared to Stanley Black & Decker, Inc.
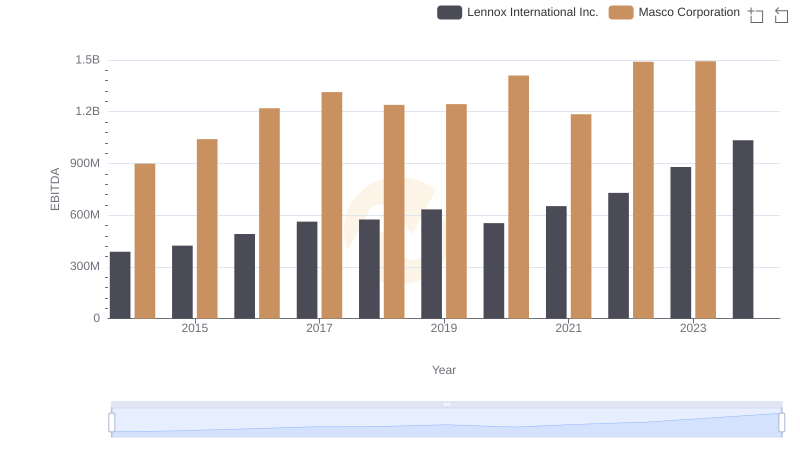
Comprehensive EBITDA Comparison: Lennox International Inc. vs Masco Corporation
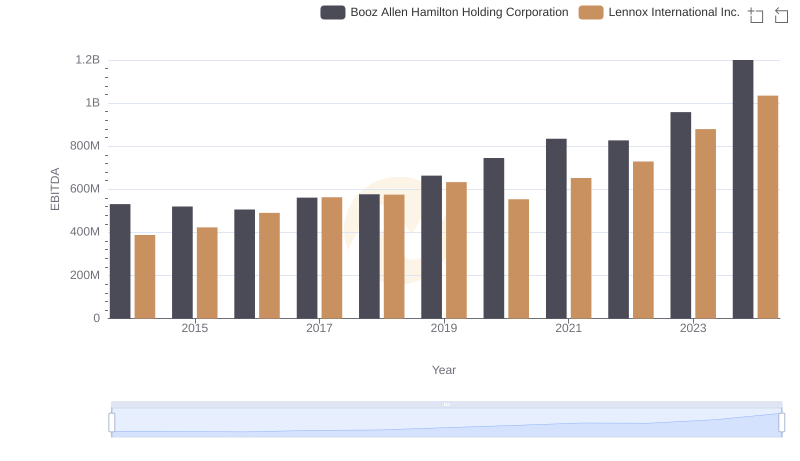
A Side-by-Side Analysis of EBITDA: Lennox International Inc. and Booz Allen Hamilton Holding Corporation
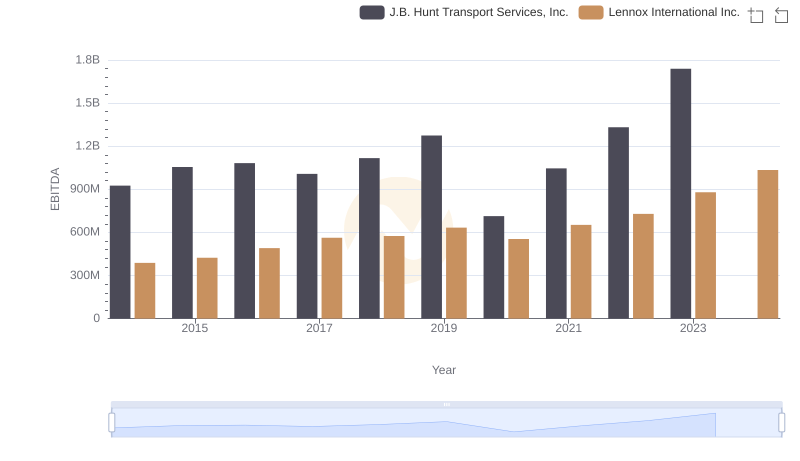
EBITDA Metrics Evaluated: Lennox International Inc. vs J.B. Hunt Transport Services, Inc.
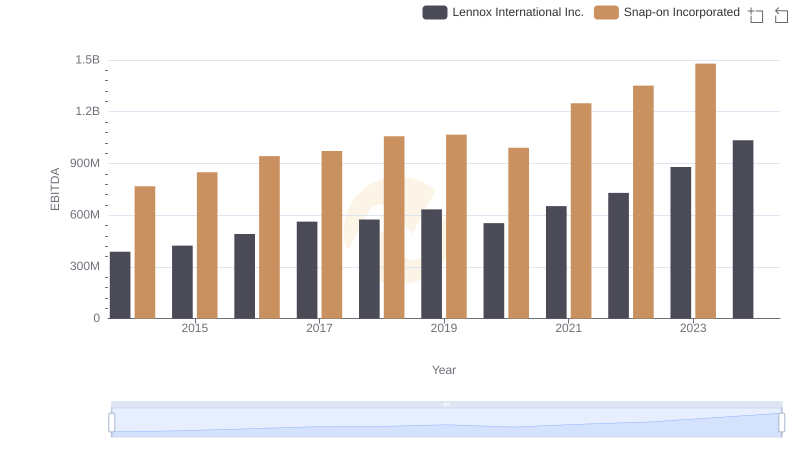
Lennox International Inc. and Snap-on Incorporated: A Detailed Examination of EBITDA Performance
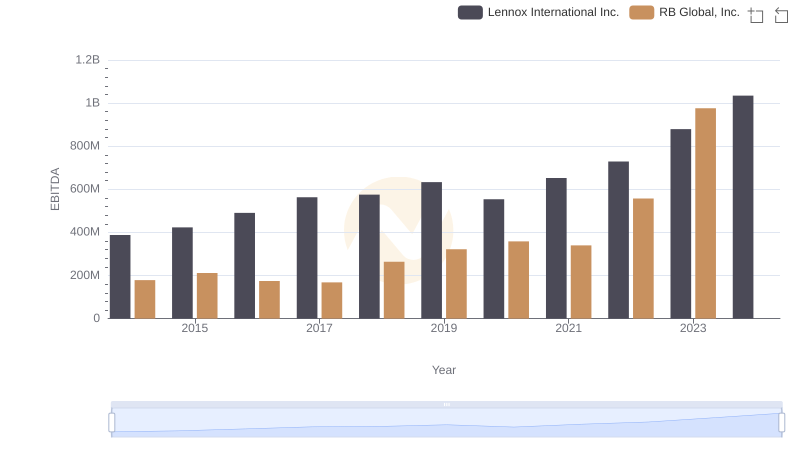
Lennox International Inc. and RB Global, Inc.: A Detailed Examination of EBITDA Performance