| __timestamp | Lennox International Inc. | Snap-on Incorporated |
|---|---|---|
| Wednesday, January 1, 2014 | 903300000 | 1584300000 |
| Thursday, January 1, 2015 | 947400000 | 1648300000 |
| Friday, January 1, 2016 | 1076500000 | 1709600000 |
| Sunday, January 1, 2017 | 1125200000 | 1824900000 |
| Monday, January 1, 2018 | 1111200000 | 1870000000 |
| Tuesday, January 1, 2019 | 1079800000 | 1844000000 |
| Wednesday, January 1, 2020 | 1040100000 | 1748500000 |
| Friday, January 1, 2021 | 1188400000 | 2110800000 |
| Saturday, January 1, 2022 | 1284700000 | 2181100000 |
| Sunday, January 1, 2023 | 1547800000 | 2619800000 |
| Monday, January 1, 2024 | 1771900000 | 2377900000 |
Data in motion
In the competitive landscape of industrial manufacturing, Lennox International Inc. and Snap-on Incorporated have showcased remarkable financial trajectories over the past decade. From 2014 to 2023, Snap-on consistently outperformed Lennox in gross profit, with a notable peak in 2023, where Snap-on's gross profit surged by approximately 65% compared to 2014. Lennox, while trailing, demonstrated a steady growth, achieving a 96% increase in the same period.
This analysis underscores the dynamic nature of industrial giants and their strategic maneuvers in the market.
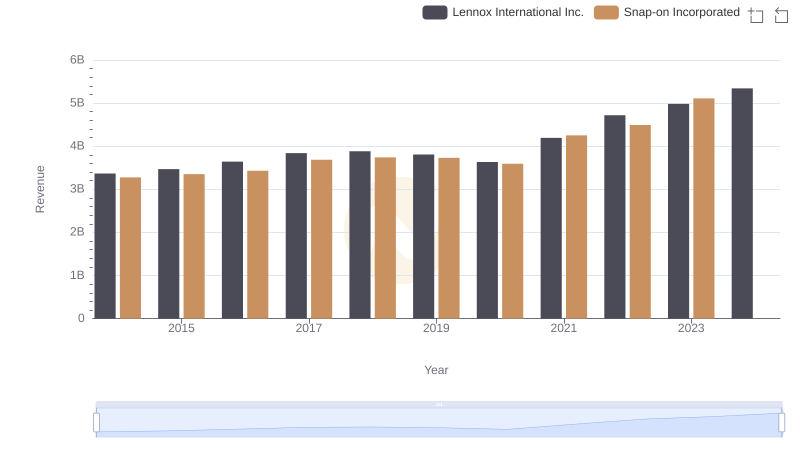
Lennox International Inc. vs Snap-on Incorporated: Examining Key Revenue Metrics
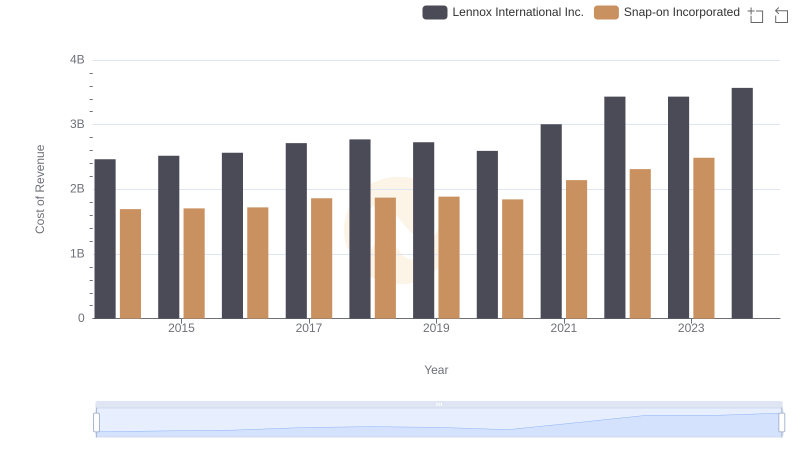
Cost Insights: Breaking Down Lennox International Inc. and Snap-on Incorporated's Expenses
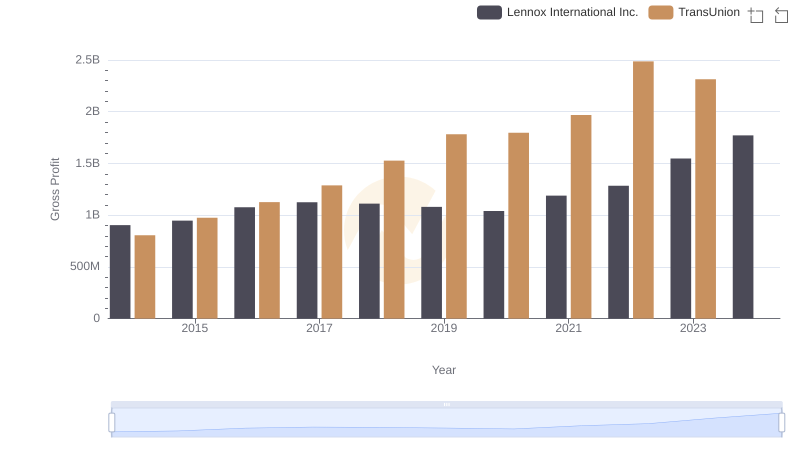
Gross Profit Trends Compared: Lennox International Inc. vs TransUnion
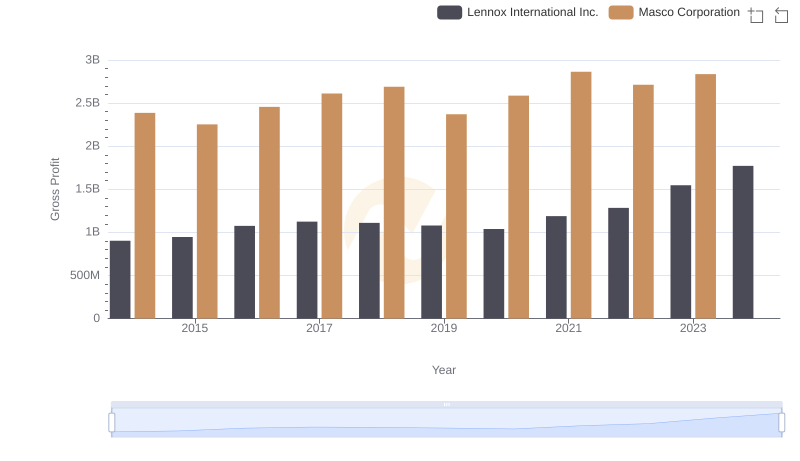
Gross Profit Trends Compared: Lennox International Inc. vs Masco Corporation
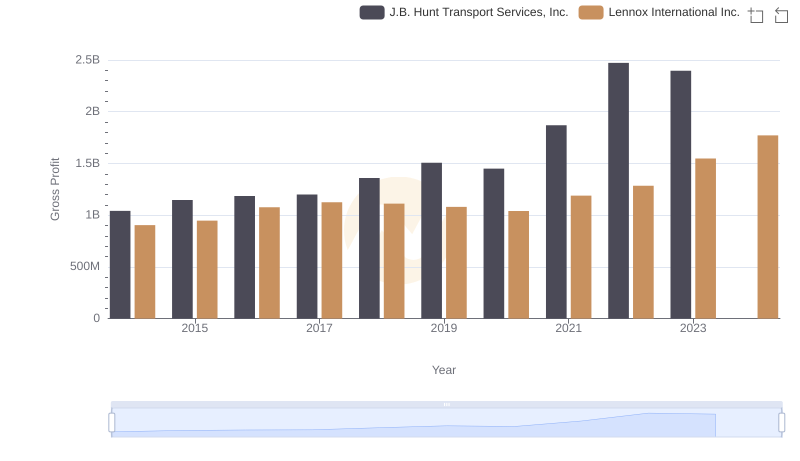
Lennox International Inc. and J.B. Hunt Transport Services, Inc.: A Detailed Gross Profit Analysis
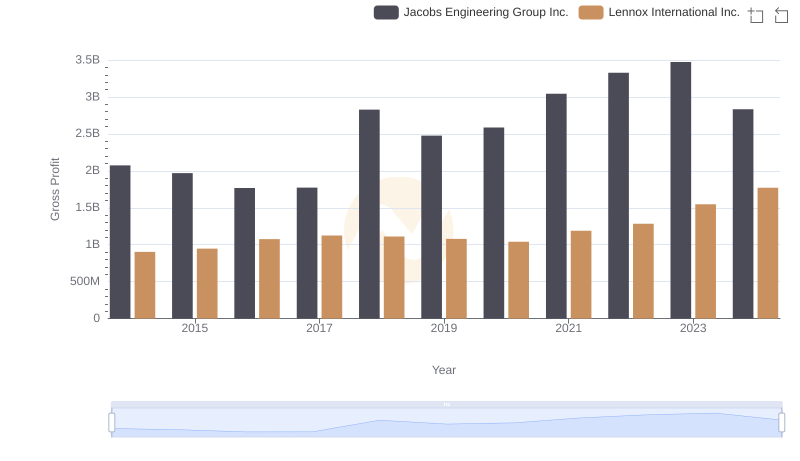
Who Generates Higher Gross Profit? Lennox International Inc. or Jacobs Engineering Group Inc.
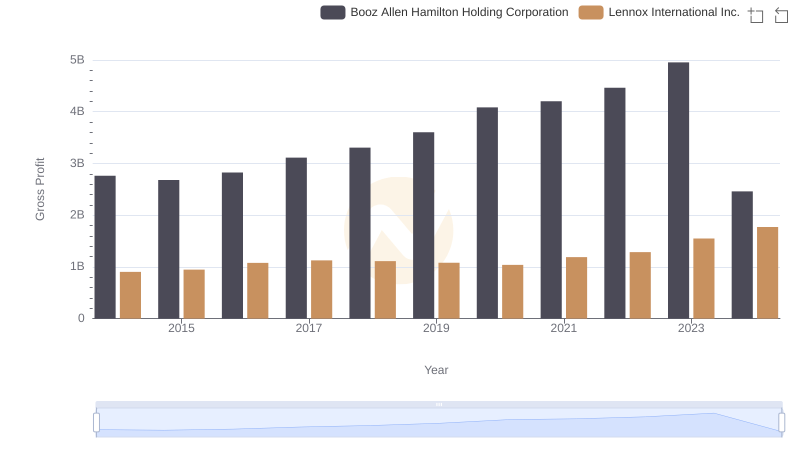
Gross Profit Trends Compared: Lennox International Inc. vs Booz Allen Hamilton Holding Corporation
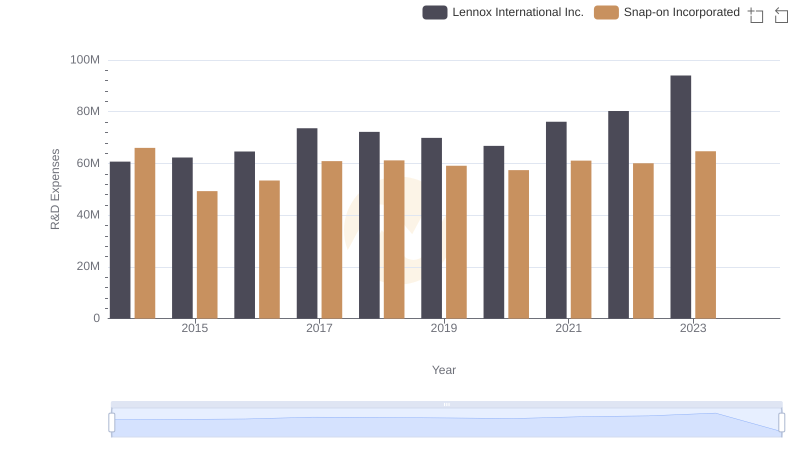
Comparing Innovation Spending: Lennox International Inc. and Snap-on Incorporated
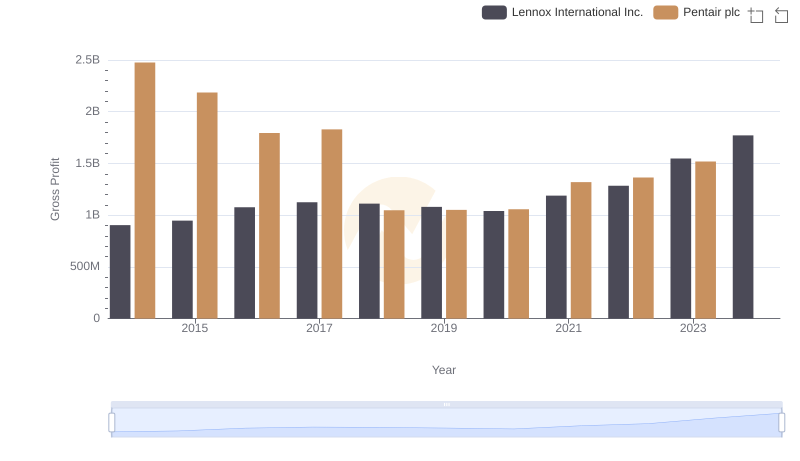
Gross Profit Analysis: Comparing Lennox International Inc. and Pentair plc
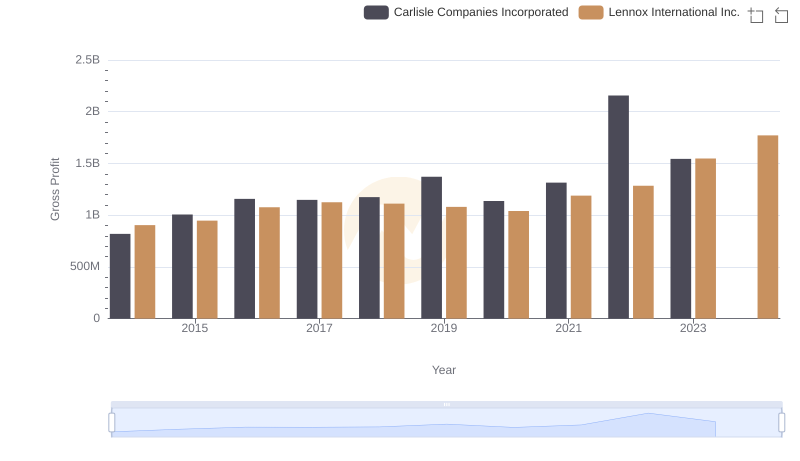
Gross Profit Trends Compared: Lennox International Inc. vs Carlisle Companies Incorporated
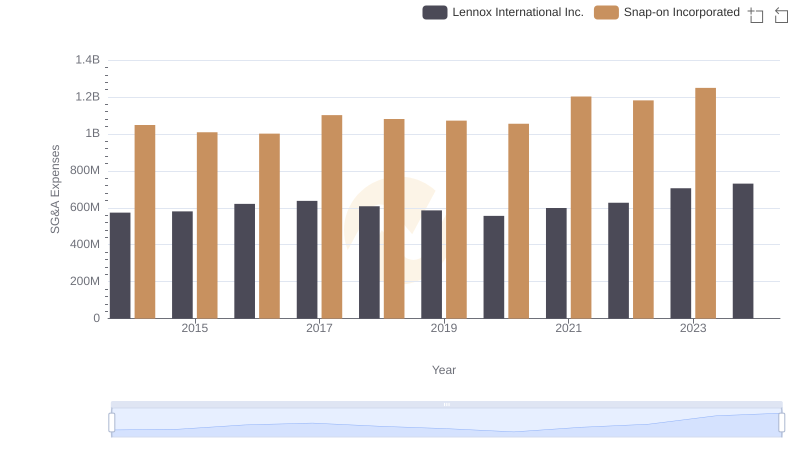
Breaking Down SG&A Expenses: Lennox International Inc. vs Snap-on Incorporated
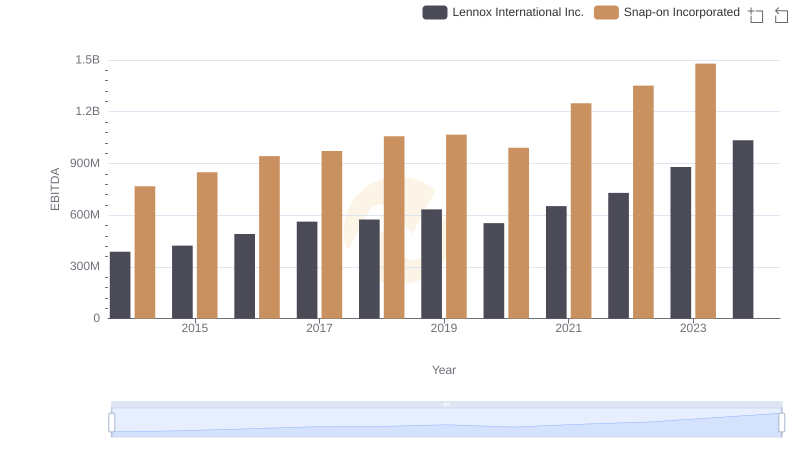
Lennox International Inc. and Snap-on Incorporated: A Detailed Examination of EBITDA Performance