| __timestamp | Lennox International Inc. | Snap-on Incorporated |
|---|---|---|
| Wednesday, January 1, 2014 | 60700000 | 66000000 |
| Thursday, January 1, 2015 | 62300000 | 49300000 |
| Friday, January 1, 2016 | 64599999 | 53400000 |
| Sunday, January 1, 2017 | 73600000 | 60900000 |
| Monday, January 1, 2018 | 72200000 | 61200000 |
| Tuesday, January 1, 2019 | 69900000 | 59100000 |
| Wednesday, January 1, 2020 | 66800000 | 57400000 |
| Friday, January 1, 2021 | 76100000 | 61100000 |
| Saturday, January 1, 2022 | 80300000 | 60100000 |
| Sunday, January 1, 2023 | 94000000 | 64700000 |
| Monday, January 1, 2024 | 0 | 0 |
Infusing magic into the data realm
In the ever-evolving landscape of industrial innovation, Lennox International Inc. and Snap-on Incorporated stand as intriguing case studies. Over the past decade, Lennox has consistently increased its research and development (R&D) spending, peaking in 2023 with a remarkable 55% increase from 2014. This upward trend underscores Lennox's commitment to innovation, even as Snap-on's R&D expenses have remained relatively stable, fluctuating around a 10% range.
From 2014 to 2023, Lennox's R&D investment grew steadily, reflecting a strategic focus on technological advancement. In contrast, Snap-on's spending, while consistent, highlights a more conservative approach. The data reveals a fascinating divergence in innovation strategies, with Lennox's aggressive investment potentially positioning it for greater breakthroughs. As we look to the future, these trends may well dictate the competitive dynamics in their respective industries.
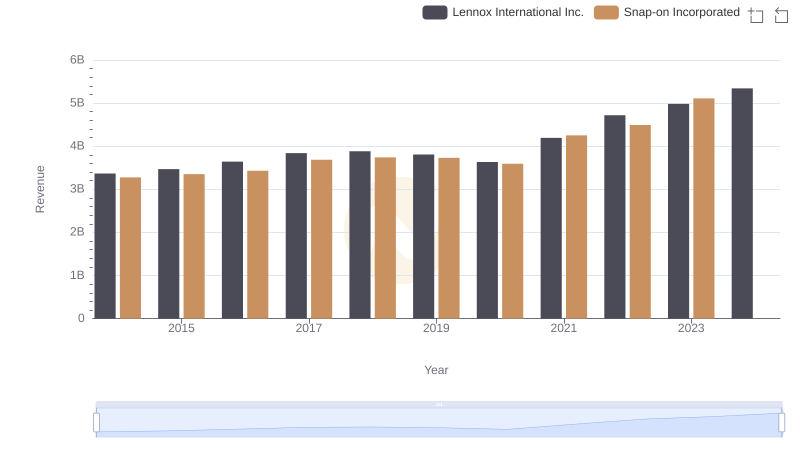
Lennox International Inc. vs Snap-on Incorporated: Examining Key Revenue Metrics
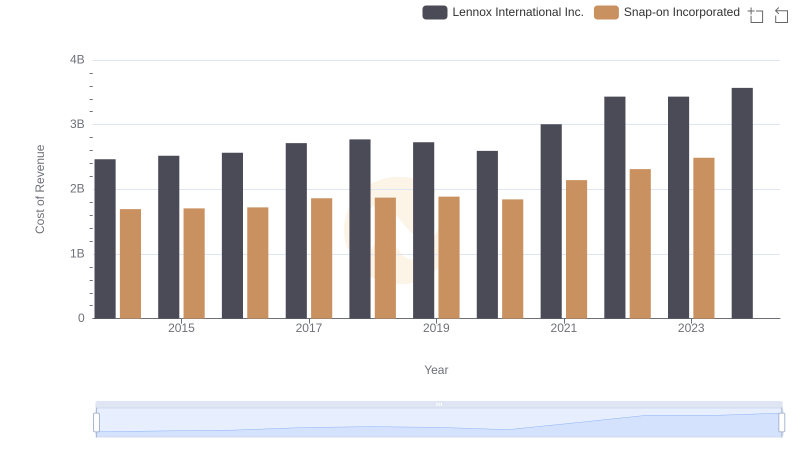
Cost Insights: Breaking Down Lennox International Inc. and Snap-on Incorporated's Expenses
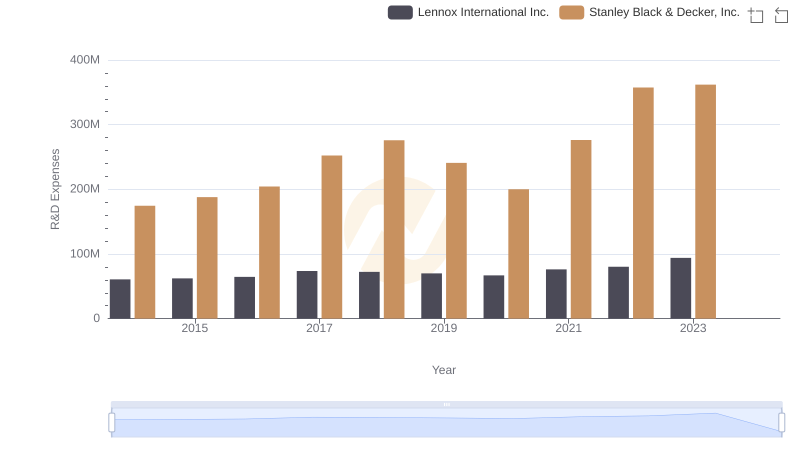
Research and Development Expenses Breakdown: Lennox International Inc. vs Stanley Black & Decker, Inc.
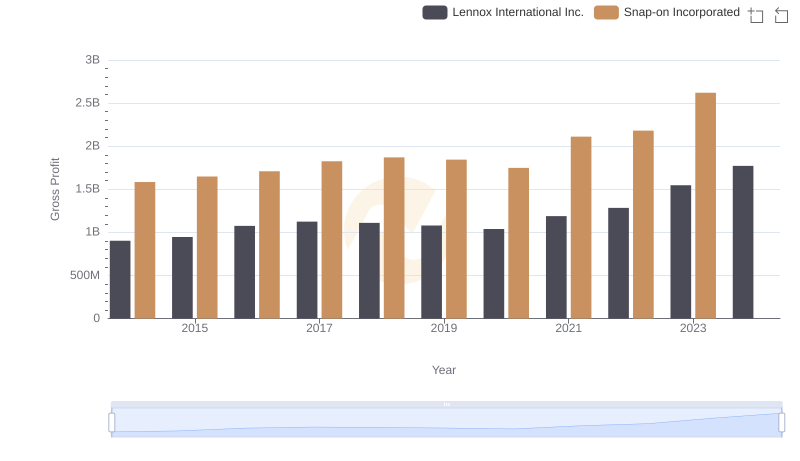
Lennox International Inc. vs Snap-on Incorporated: A Gross Profit Performance Breakdown
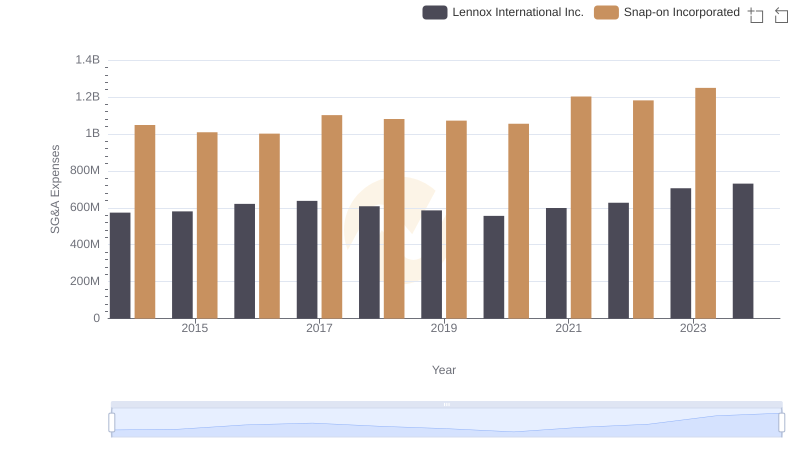
Breaking Down SG&A Expenses: Lennox International Inc. vs Snap-on Incorporated
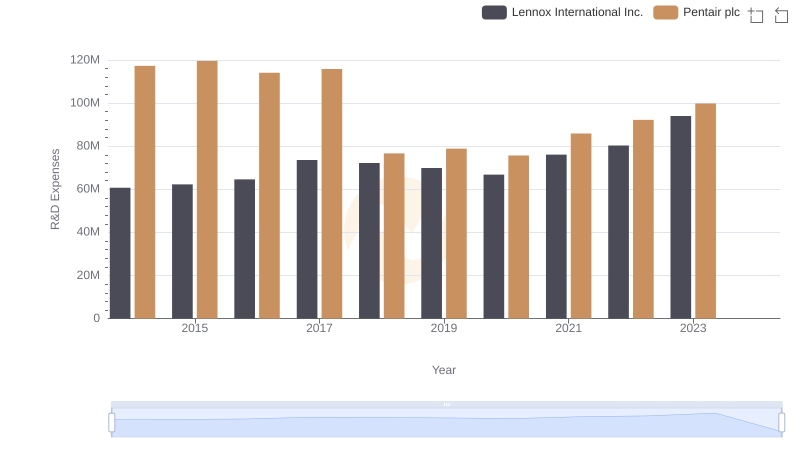
Lennox International Inc. vs Pentair plc: Strategic Focus on R&D Spending
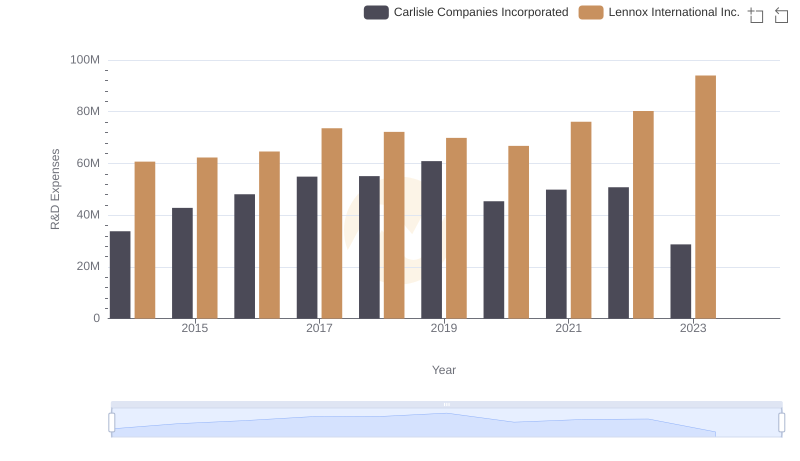
Analyzing R&D Budgets: Lennox International Inc. vs Carlisle Companies Incorporated
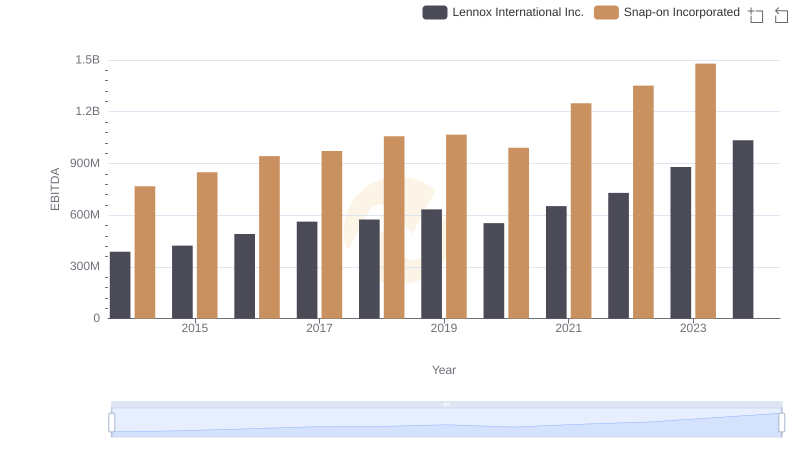
Lennox International Inc. and Snap-on Incorporated: A Detailed Examination of EBITDA Performance
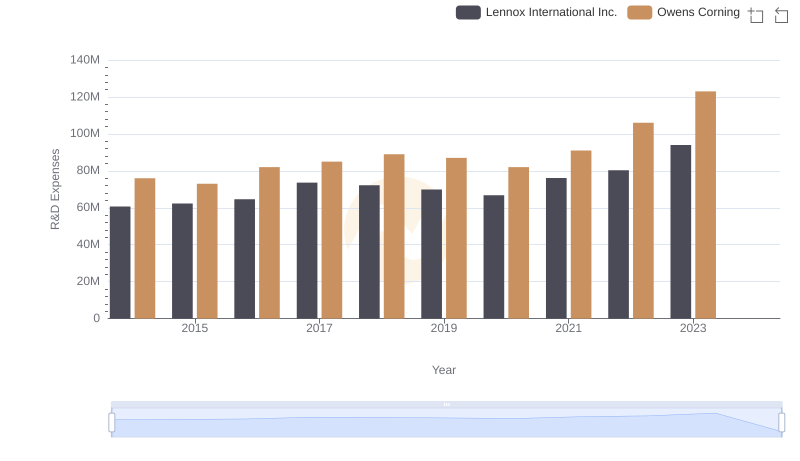
Research and Development: Comparing Key Metrics for Lennox International Inc. and Owens Corning
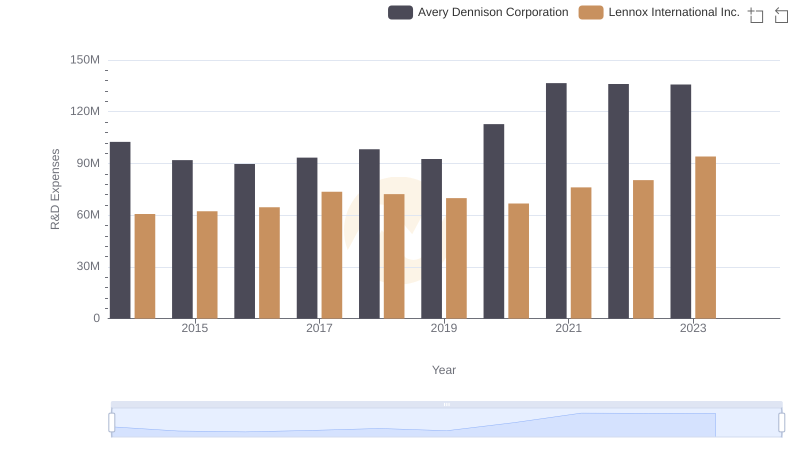
Lennox International Inc. or Avery Dennison Corporation: Who Invests More in Innovation?
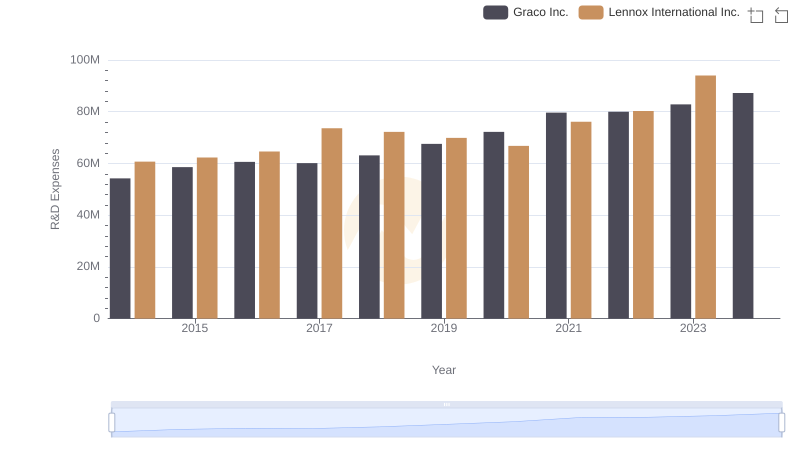
Lennox International Inc. or Graco Inc.: Who Invests More in Innovation?
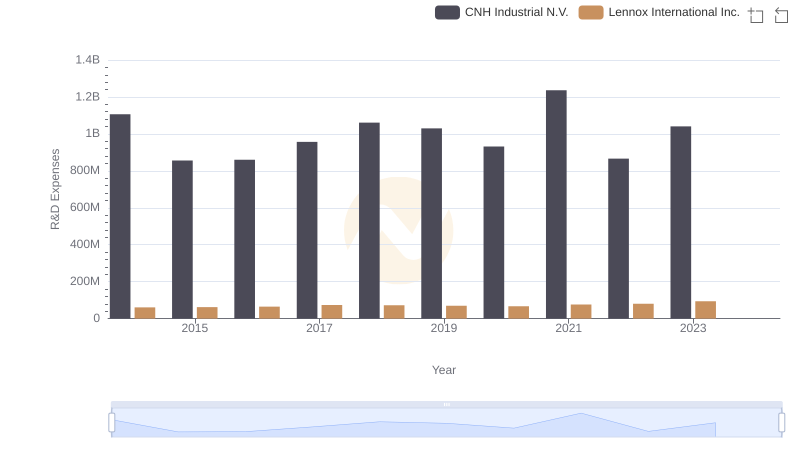
Comparing Innovation Spending: Lennox International Inc. and CNH Industrial N.V.