| __timestamp | Lennox International Inc. | Snap-on Incorporated |
|---|---|---|
| Wednesday, January 1, 2014 | 573700000 | 1047900000 |
| Thursday, January 1, 2015 | 580500000 | 1009100000 |
| Friday, January 1, 2016 | 621000000 | 1001400000 |
| Sunday, January 1, 2017 | 637700000 | 1101300000 |
| Monday, January 1, 2018 | 608200000 | 1080700000 |
| Tuesday, January 1, 2019 | 585900000 | 1071500000 |
| Wednesday, January 1, 2020 | 555900000 | 1054800000 |
| Friday, January 1, 2021 | 598900000 | 1202300000 |
| Saturday, January 1, 2022 | 627200000 | 1181200000 |
| Sunday, January 1, 2023 | 705500000 | 1249000000 |
| Monday, January 1, 2024 | 730600000 | 0 |
Unleashing insights
In the ever-evolving landscape of corporate finance, understanding Selling, General, and Administrative (SG&A) expenses is crucial for evaluating a company's operational efficiency. Over the past decade, Lennox International Inc. and Snap-on Incorporated have showcased distinct trends in their SG&A expenses. From 2014 to 2023, Lennox International Inc. saw a steady increase, with expenses rising by approximately 27%, peaking in 2024. In contrast, Snap-on Incorporated's SG&A expenses fluctuated, with a notable 19% increase from 2020 to 2023, reaching their highest in 2023. This divergence highlights the strategic differences in managing operational costs between the two companies. While Lennox's consistent growth suggests a stable expansion strategy, Snap-on's fluctuations may indicate adaptive cost management in response to market dynamics. Notably, data for Snap-on in 2024 is missing, leaving room for speculation on future trends.
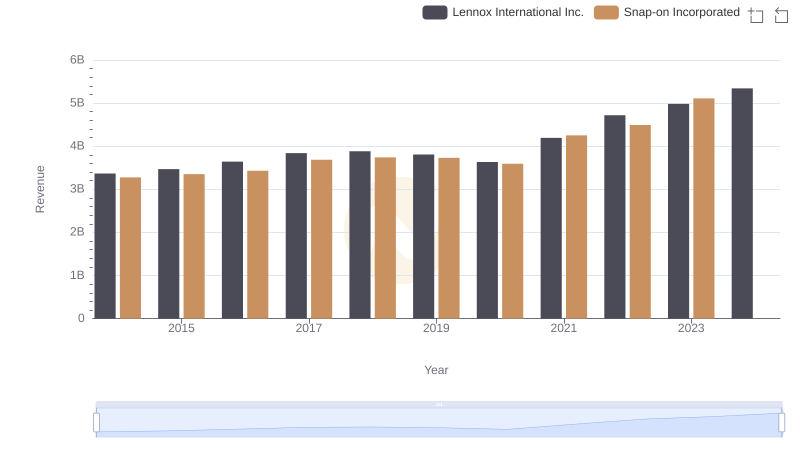
Lennox International Inc. vs Snap-on Incorporated: Examining Key Revenue Metrics
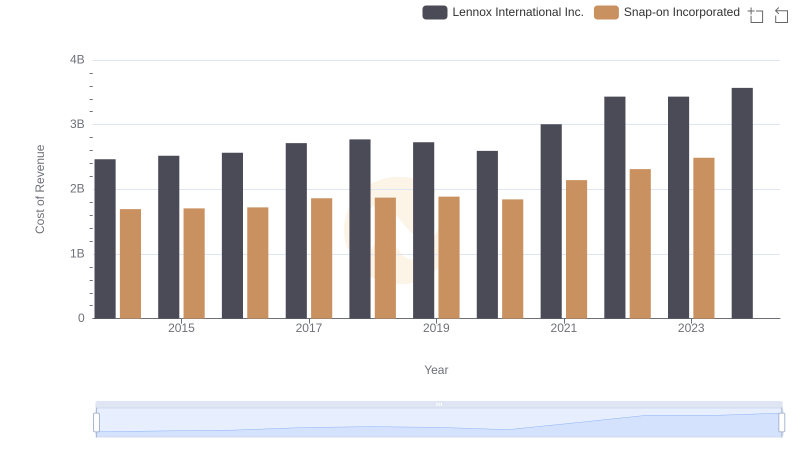
Cost Insights: Breaking Down Lennox International Inc. and Snap-on Incorporated's Expenses
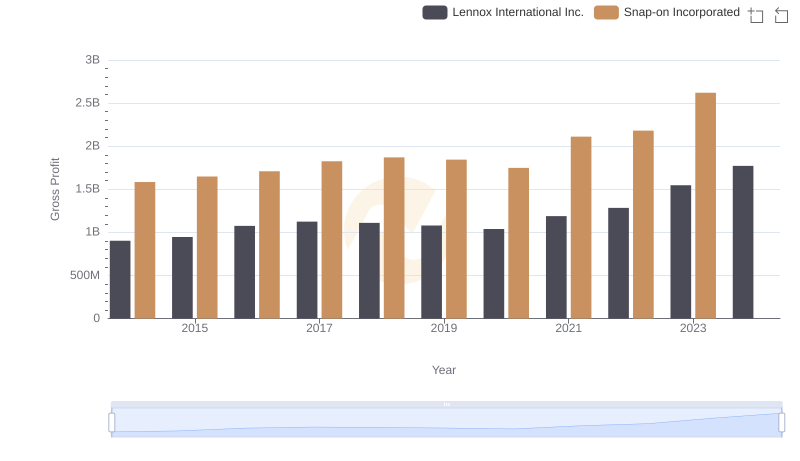
Lennox International Inc. vs Snap-on Incorporated: A Gross Profit Performance Breakdown
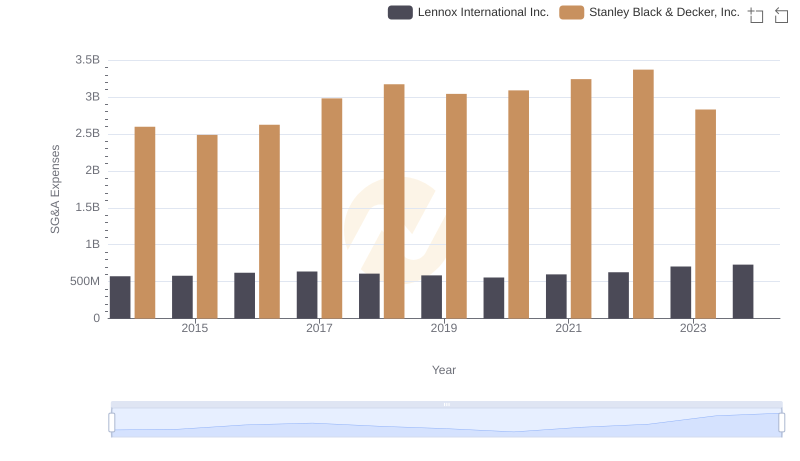
Who Optimizes SG&A Costs Better? Lennox International Inc. or Stanley Black & Decker, Inc.
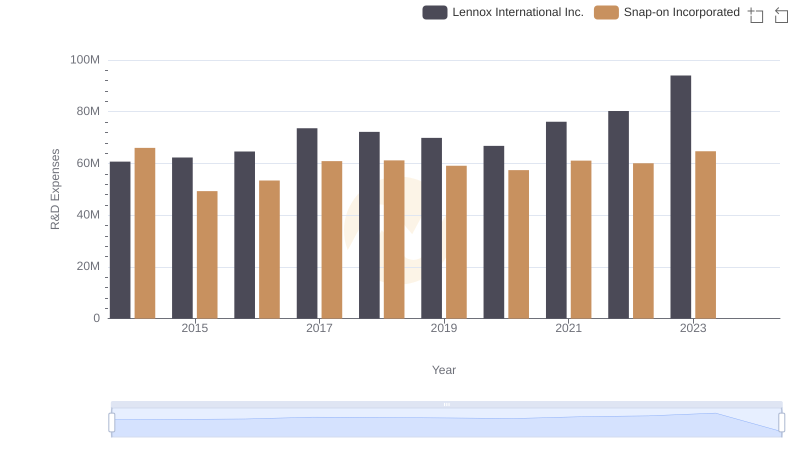
Comparing Innovation Spending: Lennox International Inc. and Snap-on Incorporated
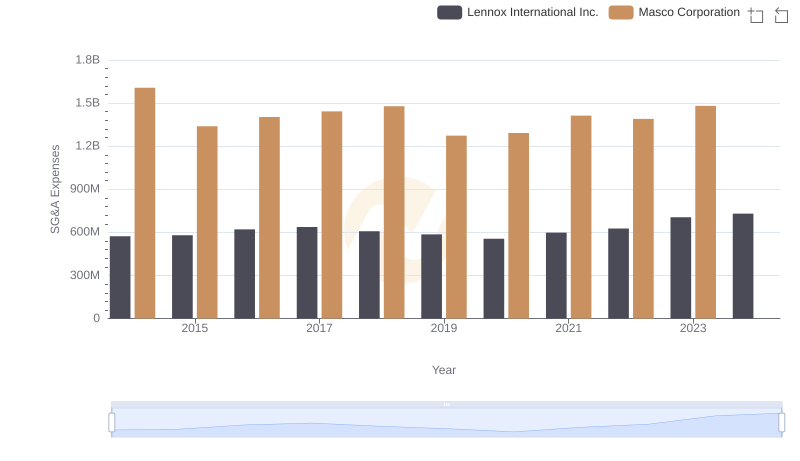
Lennox International Inc. or Masco Corporation: Who Manages SG&A Costs Better?
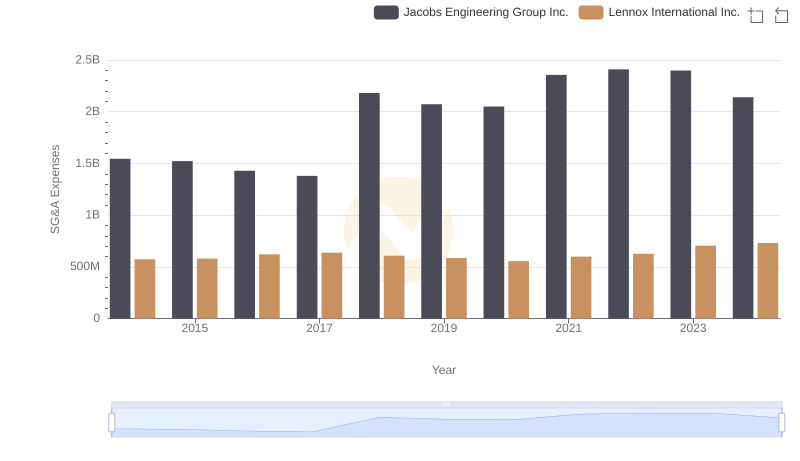
SG&A Efficiency Analysis: Comparing Lennox International Inc. and Jacobs Engineering Group Inc.
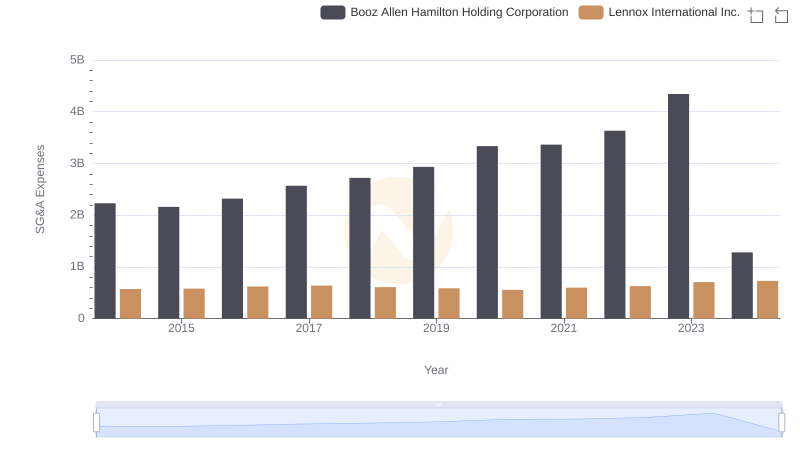
Selling, General, and Administrative Costs: Lennox International Inc. vs Booz Allen Hamilton Holding Corporation
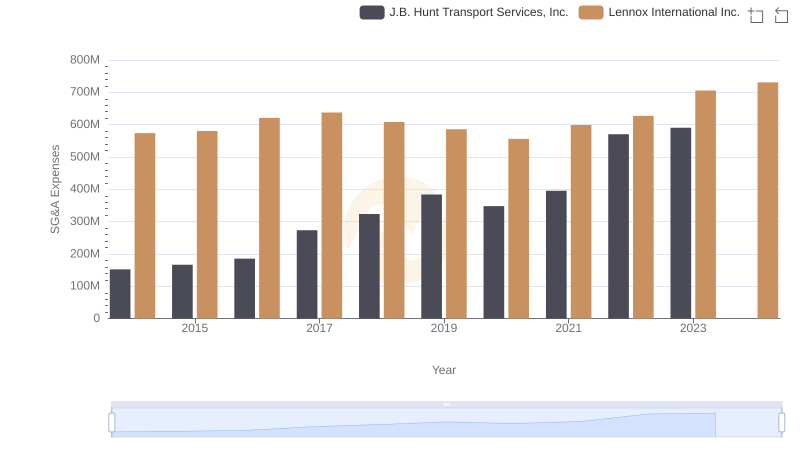
SG&A Efficiency Analysis: Comparing Lennox International Inc. and J.B. Hunt Transport Services, Inc.
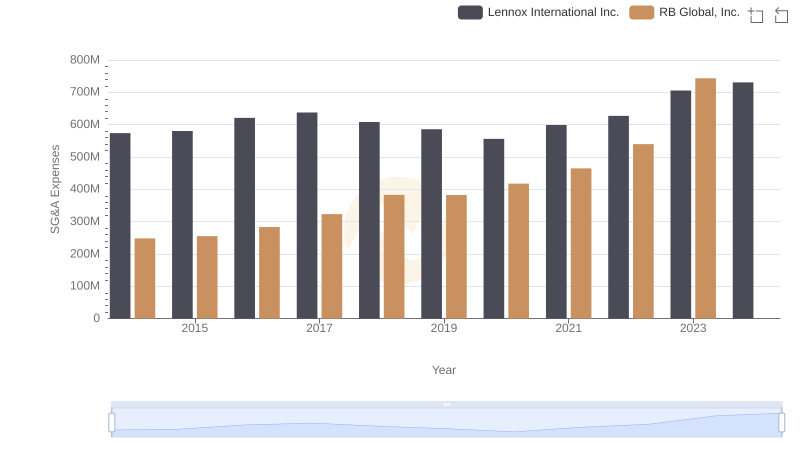
Operational Costs Compared: SG&A Analysis of Lennox International Inc. and RB Global, Inc.
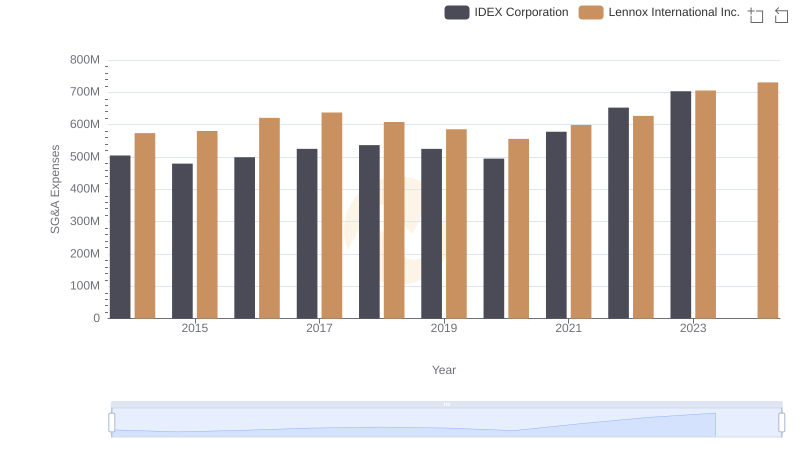
Lennox International Inc. vs IDEX Corporation: SG&A Expense Trends
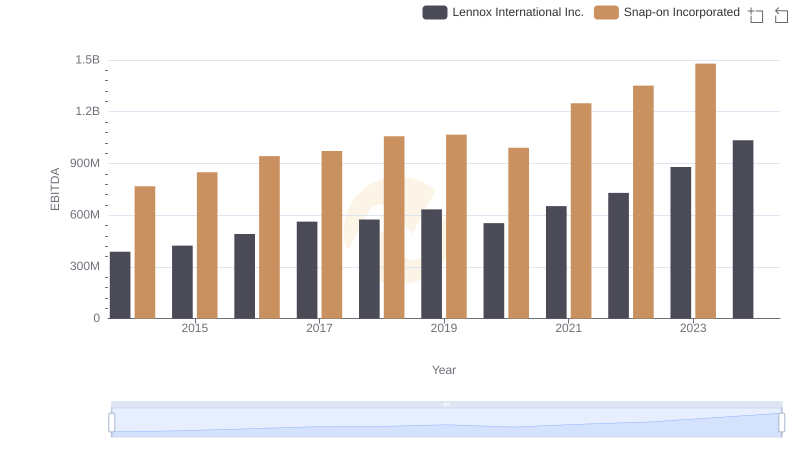
Lennox International Inc. and Snap-on Incorporated: A Detailed Examination of EBITDA Performance