| __timestamp | Lennox International Inc. | RB Global, Inc. |
|---|---|---|
| Wednesday, January 1, 2014 | 387700000 | 178851000 |
| Thursday, January 1, 2015 | 423600000 | 211417000 |
| Friday, January 1, 2016 | 490800000 | 174791291 |
| Sunday, January 1, 2017 | 562900000 | 168379000 |
| Monday, January 1, 2018 | 575200000 | 263653000 |
| Tuesday, January 1, 2019 | 633300000 | 322140110 |
| Wednesday, January 1, 2020 | 553900000 | 358617000 |
| Friday, January 1, 2021 | 652500000 | 339928424 |
| Saturday, January 1, 2022 | 729000000 | 557399151 |
| Sunday, January 1, 2023 | 879500000 | 975874087 |
| Monday, January 1, 2024 | 1034800000 | 761100000 |
Unveiling the hidden dimensions of data
In the ever-evolving landscape of the HVAC and auction industries, Lennox International Inc. and RB Global, Inc. have demonstrated remarkable EBITDA growth over the past decade. From 2014 to 2023, Lennox International Inc. has seen its EBITDA surge by approximately 167%, reflecting its robust market strategies and operational efficiencies. Meanwhile, RB Global, Inc. has experienced an impressive 446% increase in EBITDA, showcasing its adaptability and growth in the auction sector.
This analysis highlights the dynamic growth trajectories of these industry leaders, offering valuable insights for investors and market analysts.
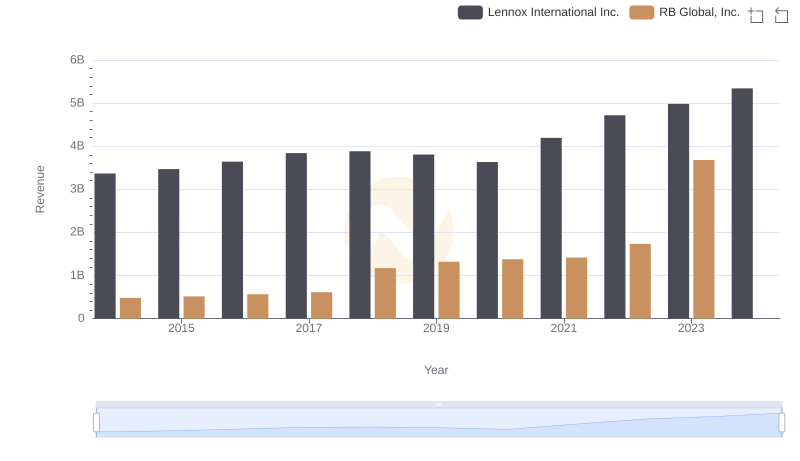
Comparing Revenue Performance: Lennox International Inc. or RB Global, Inc.?
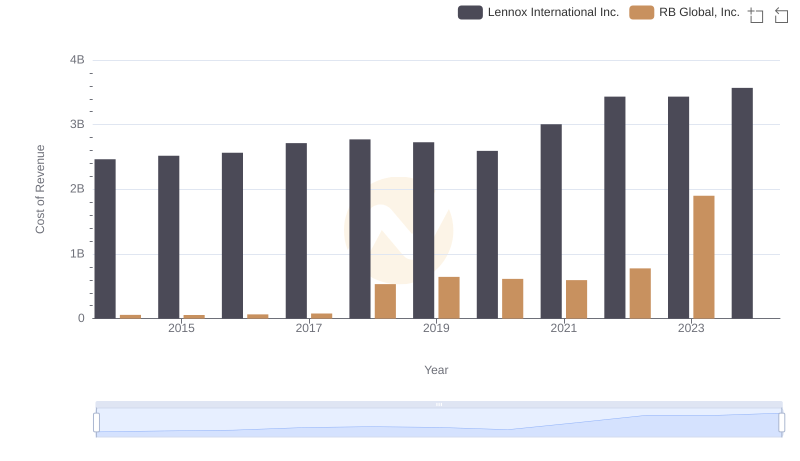
Cost of Revenue Comparison: Lennox International Inc. vs RB Global, Inc.
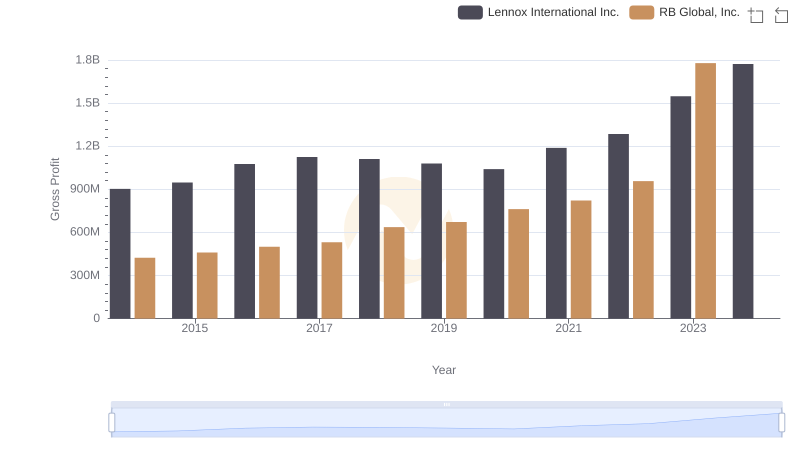
Lennox International Inc. vs RB Global, Inc.: A Gross Profit Performance Breakdown
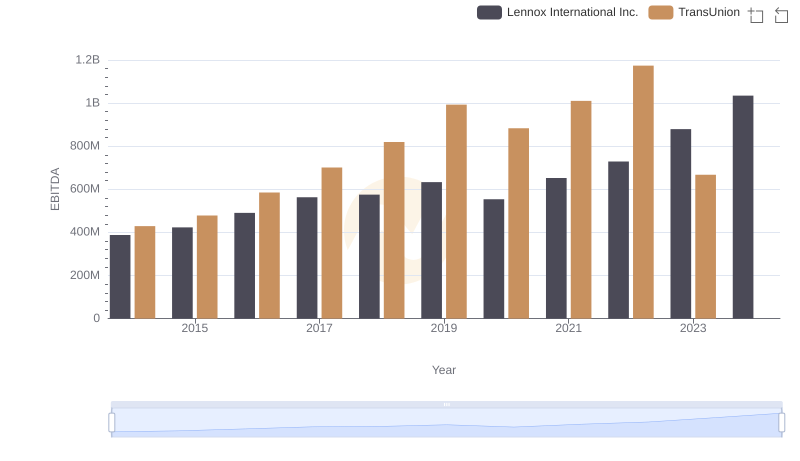
EBITDA Performance Review: Lennox International Inc. vs TransUnion

A Professional Review of EBITDA: Lennox International Inc. Compared to Stanley Black & Decker, Inc.
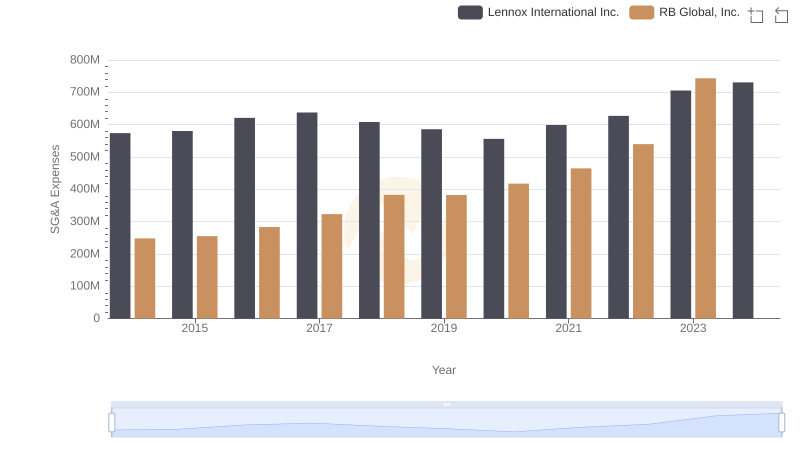
Operational Costs Compared: SG&A Analysis of Lennox International Inc. and RB Global, Inc.
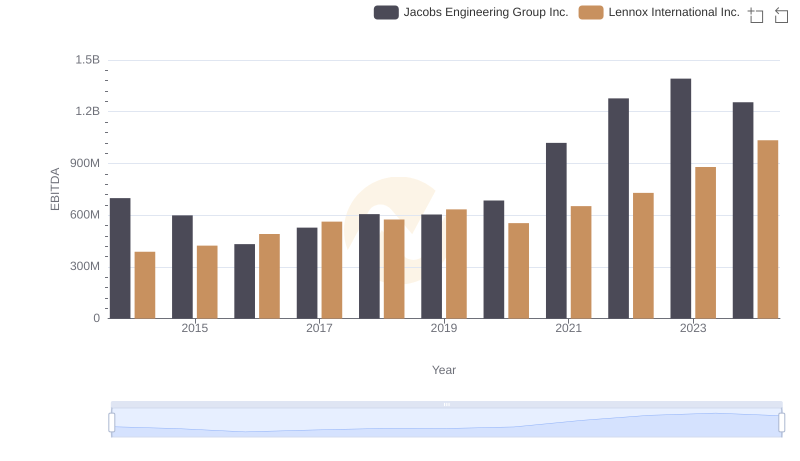
Lennox International Inc. and Jacobs Engineering Group Inc.: A Detailed Examination of EBITDA Performance
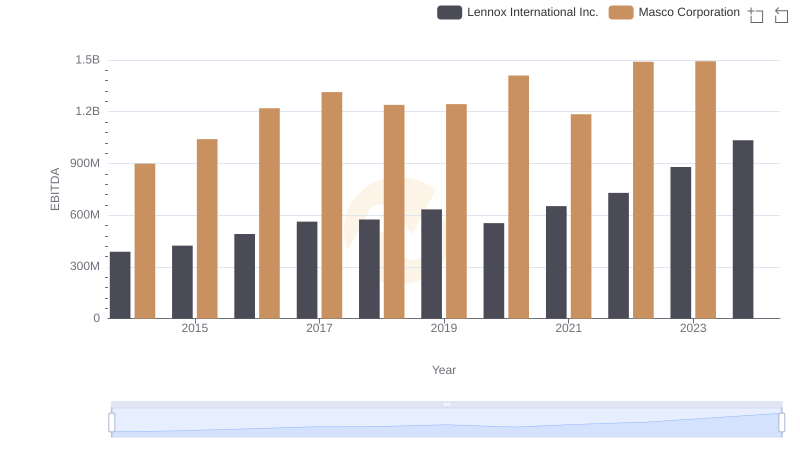
Comprehensive EBITDA Comparison: Lennox International Inc. vs Masco Corporation
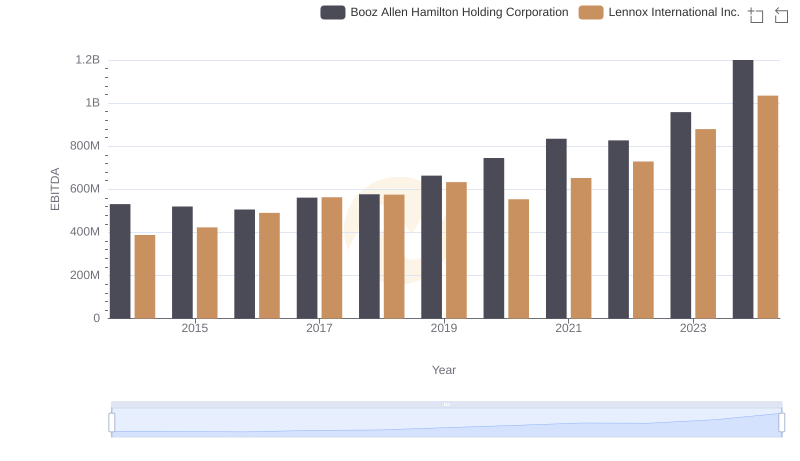
A Side-by-Side Analysis of EBITDA: Lennox International Inc. and Booz Allen Hamilton Holding Corporation
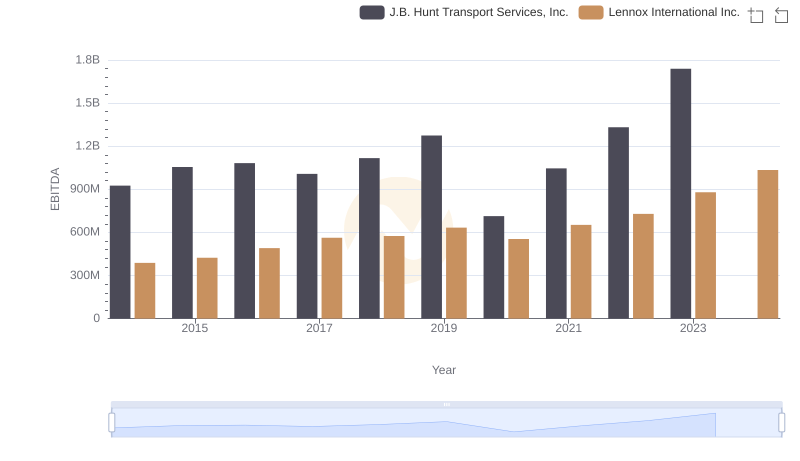
EBITDA Metrics Evaluated: Lennox International Inc. vs J.B. Hunt Transport Services, Inc.
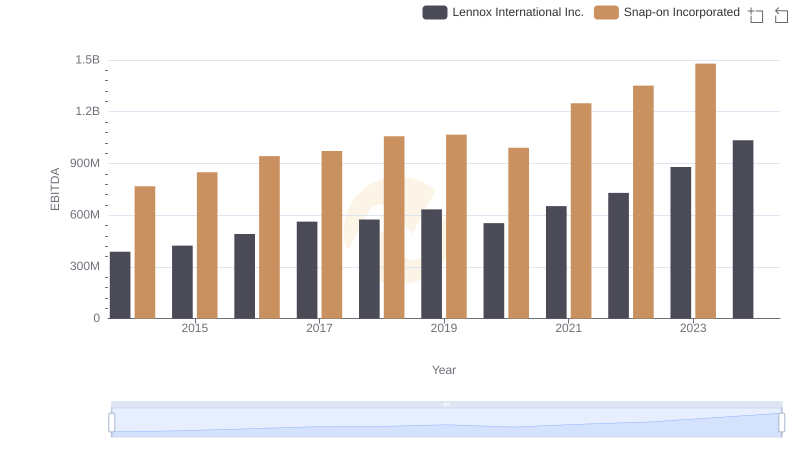
Lennox International Inc. and Snap-on Incorporated: A Detailed Examination of EBITDA Performance
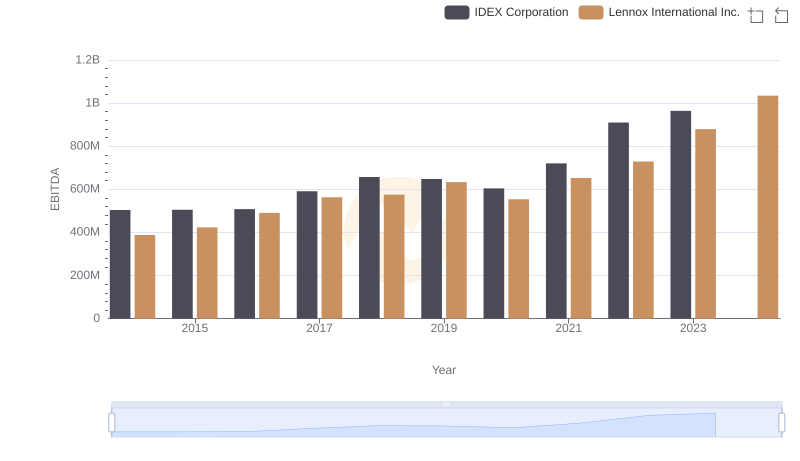
A Professional Review of EBITDA: Lennox International Inc. Compared to IDEX Corporation