| __timestamp | Hubbell Incorporated | Lennox International Inc. |
|---|---|---|
| Wednesday, January 1, 2014 | 1109000000 | 903300000 |
| Thursday, January 1, 2015 | 1091800000 | 947400000 |
| Friday, January 1, 2016 | 1100700000 | 1076500000 |
| Sunday, January 1, 2017 | 1151900000 | 1125200000 |
| Monday, January 1, 2018 | 1300400000 | 1111200000 |
| Tuesday, January 1, 2019 | 1352700000 | 1079800000 |
| Wednesday, January 1, 2020 | 1209300000 | 1040100000 |
| Friday, January 1, 2021 | 1151500000 | 1188400000 |
| Saturday, January 1, 2022 | 1471600000 | 1284700000 |
| Sunday, January 1, 2023 | 1888100000 | 1547800000 |
| Monday, January 1, 2024 | 1904100000 | 1771900000 |
Igniting the spark of knowledge
In the competitive landscape of industrial manufacturing, Lennox International Inc. and Hubbell Incorporated have been pivotal players. Over the past decade, these companies have showcased remarkable growth in their gross profits. From 2014 to 2023, Hubbell Incorporated's gross profit surged by approximately 70%, peaking in 2023. Meanwhile, Lennox International Inc. demonstrated a steady upward trajectory, with a notable 72% increase in gross profit over the same period, reaching its zenith in 2024.
Despite a dip in 2020, likely due to global economic challenges, both companies rebounded strongly. By 2023, Lennox International Inc. had closed the gap, achieving a gross profit that was 82% of Hubbell's. This data highlights the resilience and strategic prowess of these industry leaders, setting a benchmark for others in the sector.
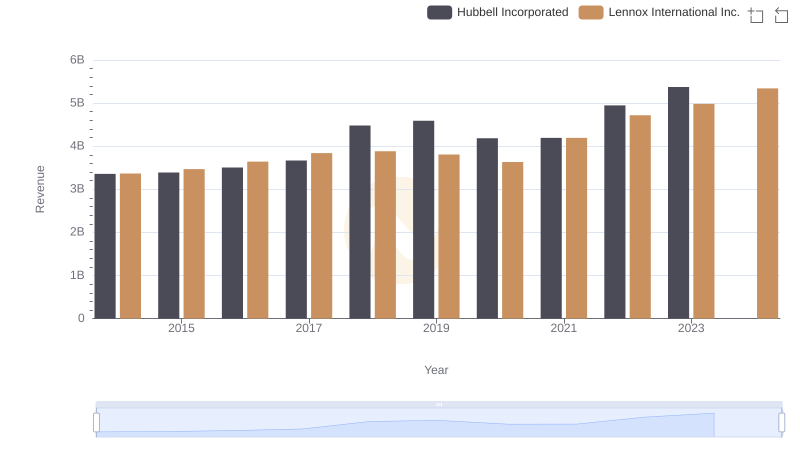
Revenue Showdown: Lennox International Inc. vs Hubbell Incorporated
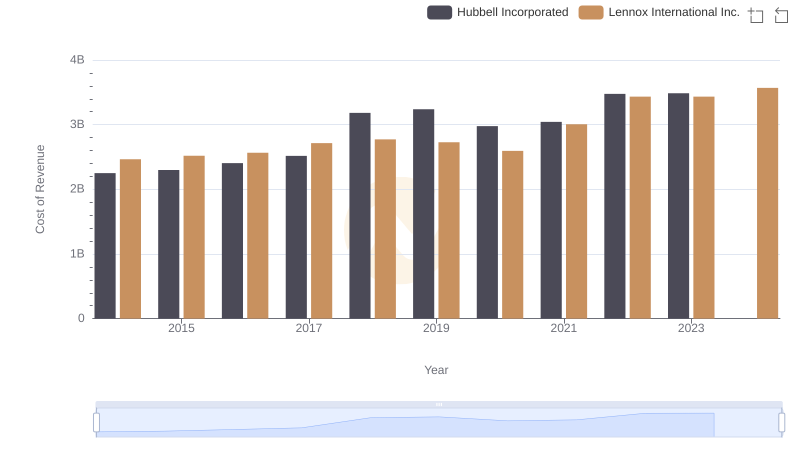
Cost of Revenue Comparison: Lennox International Inc. vs Hubbell Incorporated
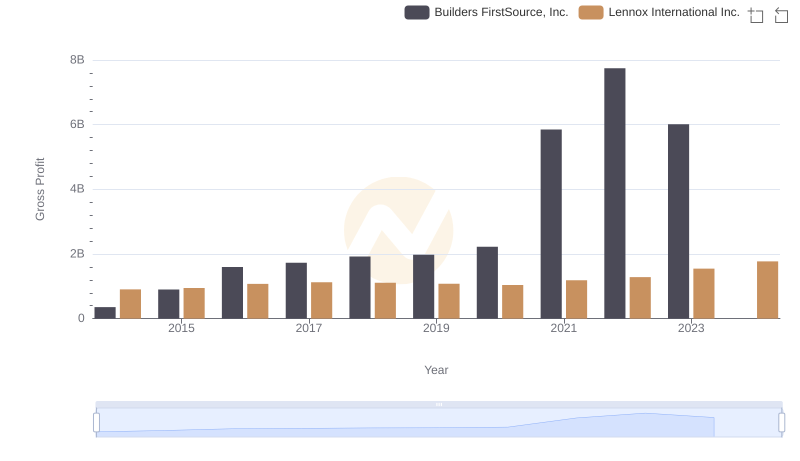
Gross Profit Trends Compared: Lennox International Inc. vs Builders FirstSource, Inc.
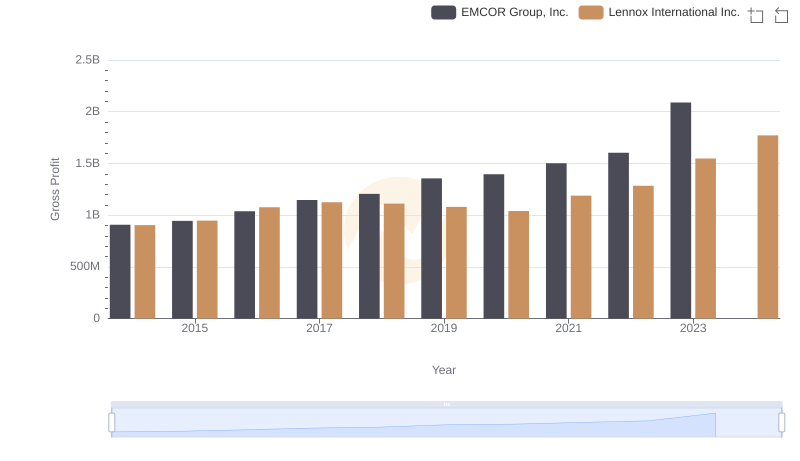
Gross Profit Trends Compared: Lennox International Inc. vs EMCOR Group, Inc.
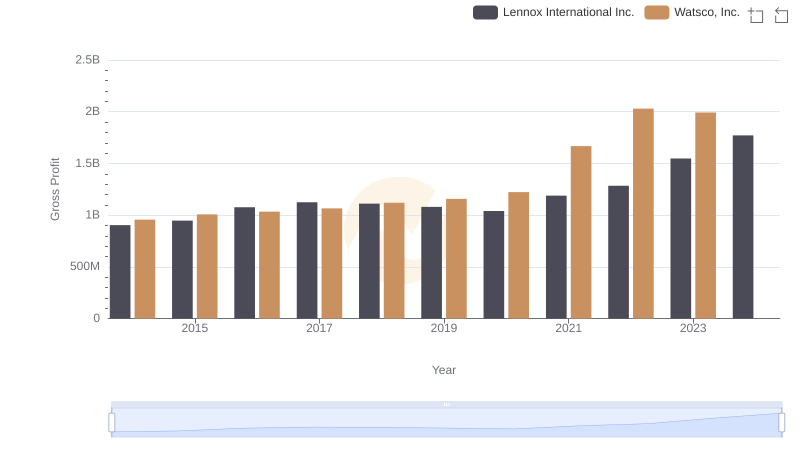
Lennox International Inc. and Watsco, Inc.: A Detailed Gross Profit Analysis
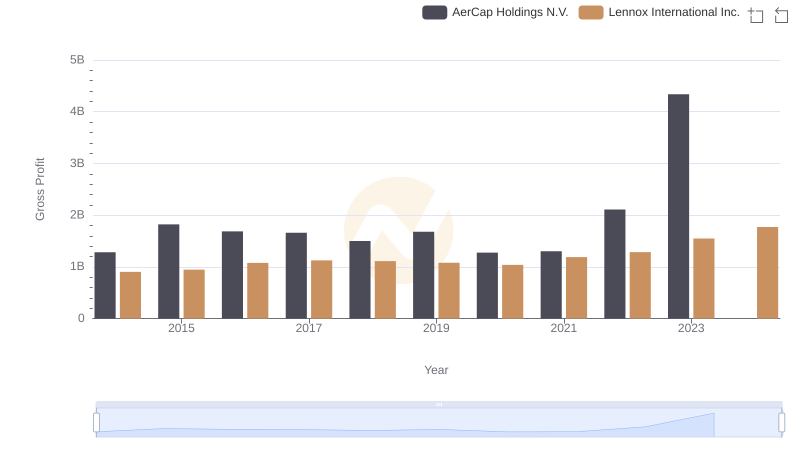
Gross Profit Trends Compared: Lennox International Inc. vs AerCap Holdings N.V.
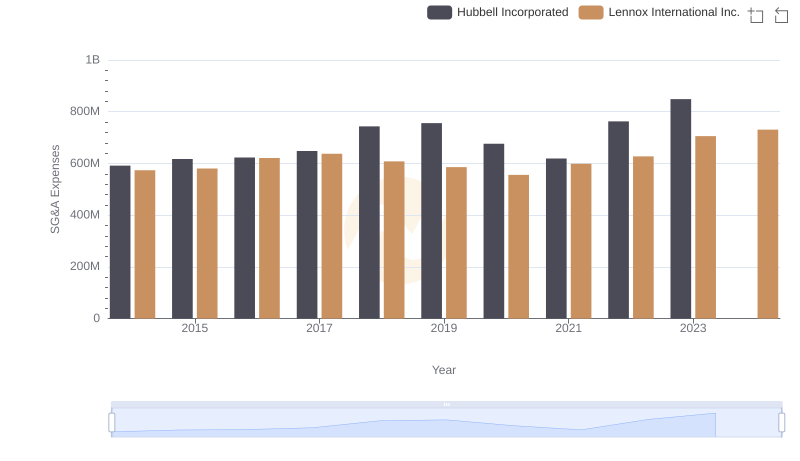
Breaking Down SG&A Expenses: Lennox International Inc. vs Hubbell Incorporated
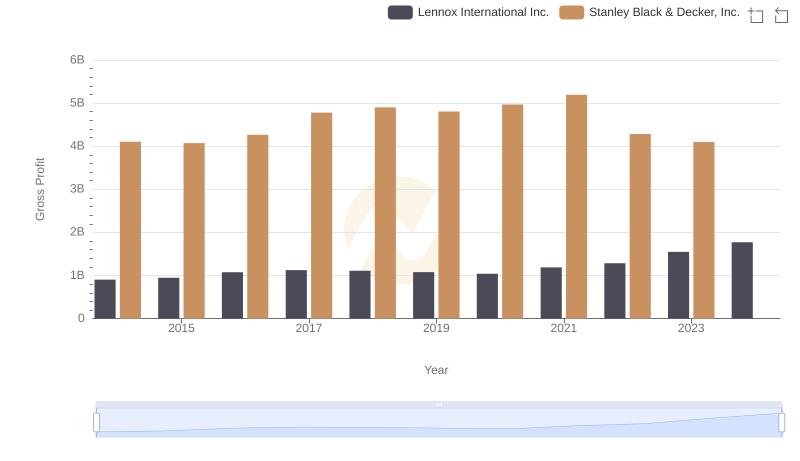
Key Insights on Gross Profit: Lennox International Inc. vs Stanley Black & Decker, Inc.
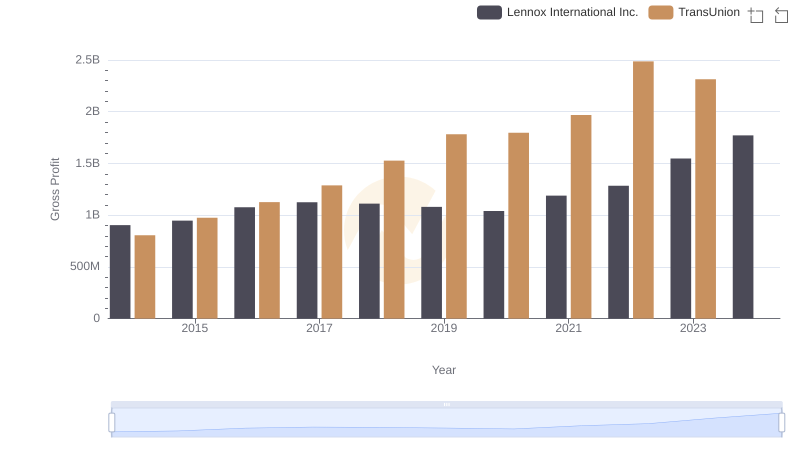
Gross Profit Trends Compared: Lennox International Inc. vs TransUnion
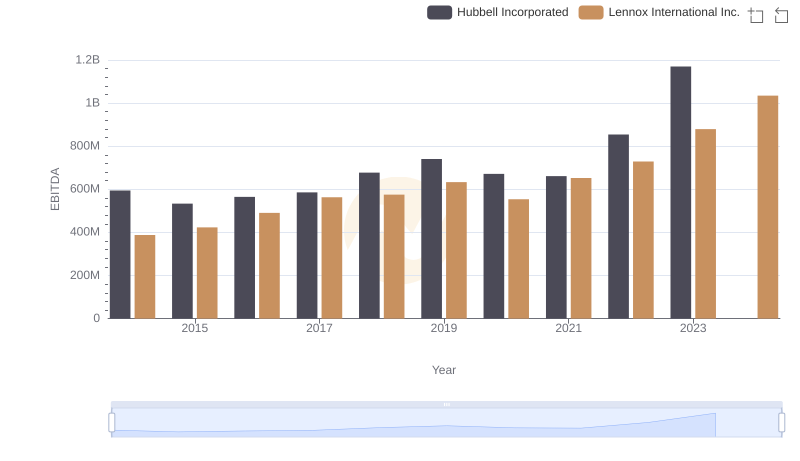
A Side-by-Side Analysis of EBITDA: Lennox International Inc. and Hubbell Incorporated
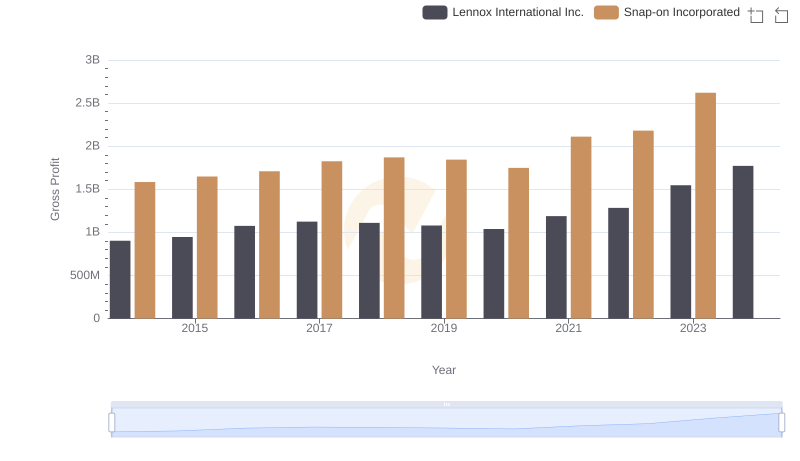
Lennox International Inc. vs Snap-on Incorporated: A Gross Profit Performance Breakdown
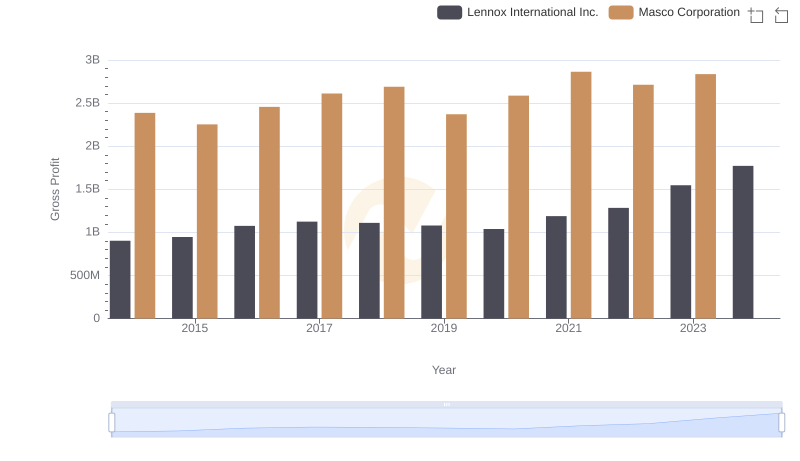
Gross Profit Trends Compared: Lennox International Inc. vs Masco Corporation