| __timestamp | Lennox International Inc. | Watsco, Inc. |
|---|---|---|
| Wednesday, January 1, 2014 | 903300000 | 956402000 |
| Thursday, January 1, 2015 | 947400000 | 1007357000 |
| Friday, January 1, 2016 | 1076500000 | 1034584000 |
| Sunday, January 1, 2017 | 1125200000 | 1065659000 |
| Monday, January 1, 2018 | 1111200000 | 1120252000 |
| Tuesday, January 1, 2019 | 1079800000 | 1156956000 |
| Wednesday, January 1, 2020 | 1040100000 | 1222821000 |
| Friday, January 1, 2021 | 1188400000 | 1667545000 |
| Saturday, January 1, 2022 | 1284700000 | 2030289000 |
| Sunday, January 1, 2023 | 1547800000 | 1992140000 |
| Monday, January 1, 2024 | 1771900000 | 2044713000 |
Unlocking the unknown
In the ever-evolving landscape of the HVAC industry, Lennox International Inc. and Watsco, Inc. have emerged as key players. Over the past decade, these companies have demonstrated remarkable growth in their gross profits, reflecting their strategic prowess and market adaptability.
From 2014 to 2023, Lennox International Inc. saw a steady increase in gross profit, culminating in a 96% rise by 2023. Meanwhile, Watsco, Inc. experienced a similar upward trajectory, with a notable 108% increase over the same period. This growth underscores the robust demand for HVAC solutions and the companies' ability to capitalize on market opportunities.
While Lennox's data extends into 2024, Watsco's figures for that year remain unavailable, leaving room for speculation on its future performance. This gap highlights the importance of continuous data monitoring for accurate market predictions.
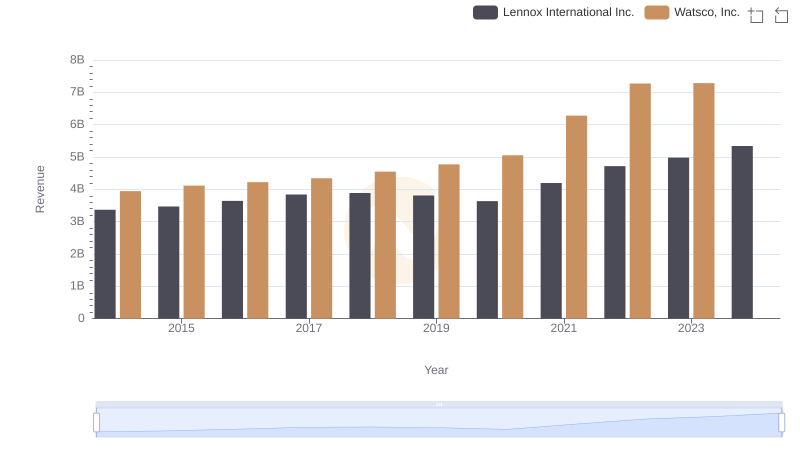
Comparing Revenue Performance: Lennox International Inc. or Watsco, Inc.?
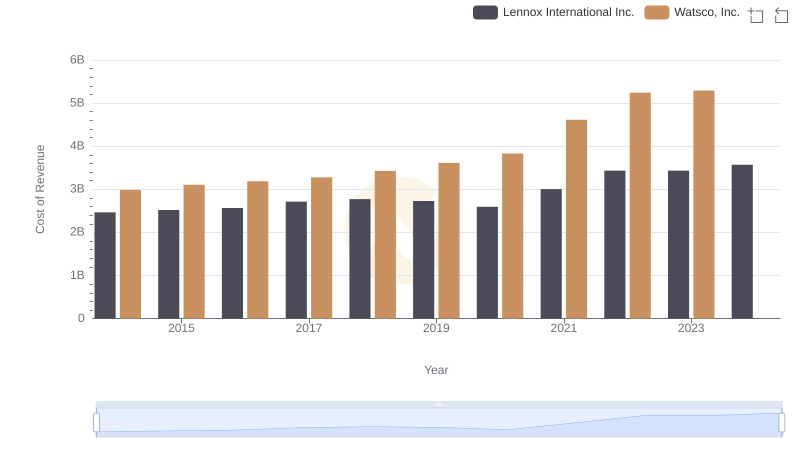
Cost of Revenue Trends: Lennox International Inc. vs Watsco, Inc.
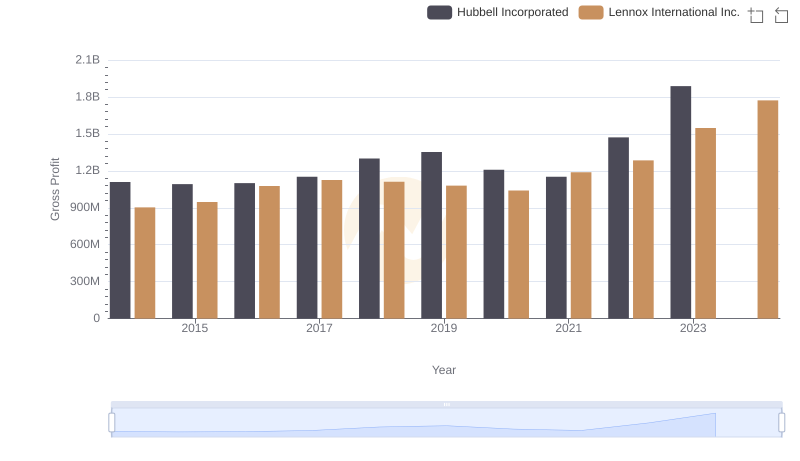
Key Insights on Gross Profit: Lennox International Inc. vs Hubbell Incorporated
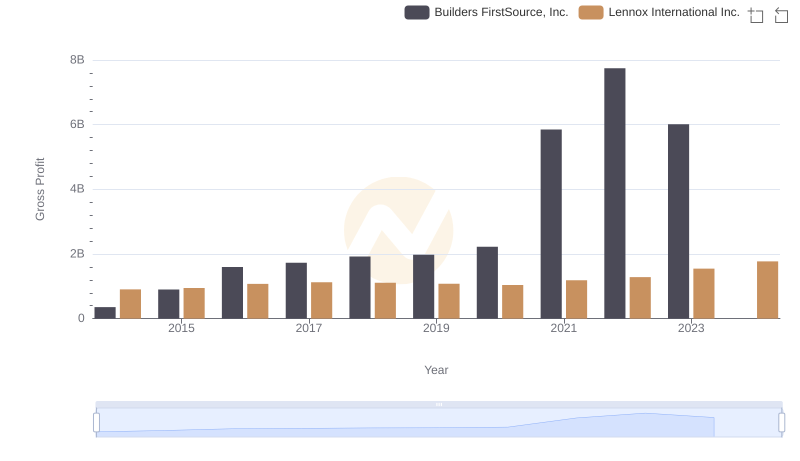
Gross Profit Trends Compared: Lennox International Inc. vs Builders FirstSource, Inc.
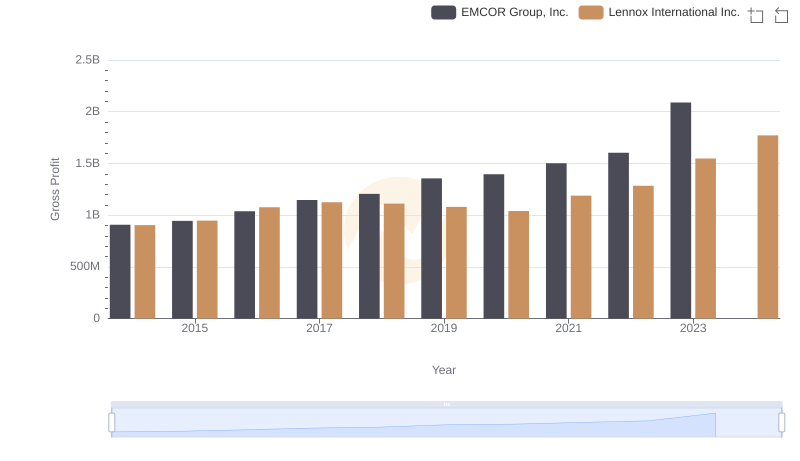
Gross Profit Trends Compared: Lennox International Inc. vs EMCOR Group, Inc.
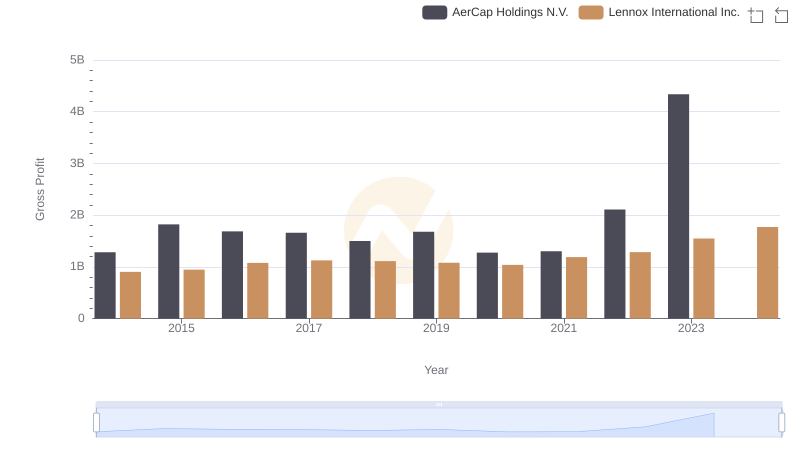
Gross Profit Trends Compared: Lennox International Inc. vs AerCap Holdings N.V.
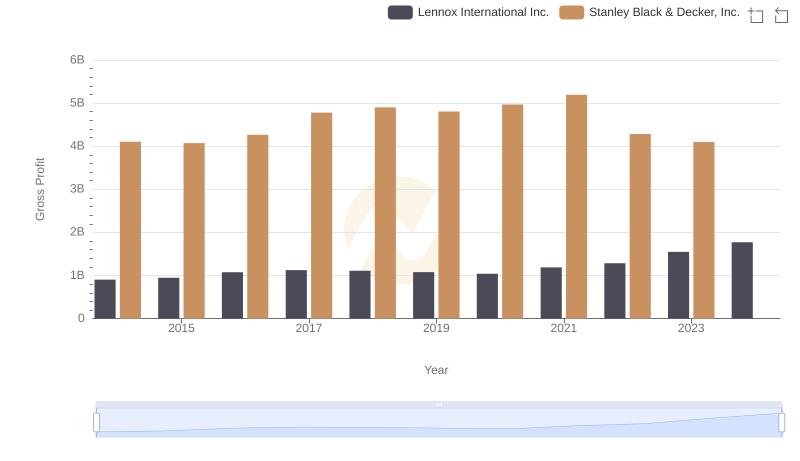
Key Insights on Gross Profit: Lennox International Inc. vs Stanley Black & Decker, Inc.
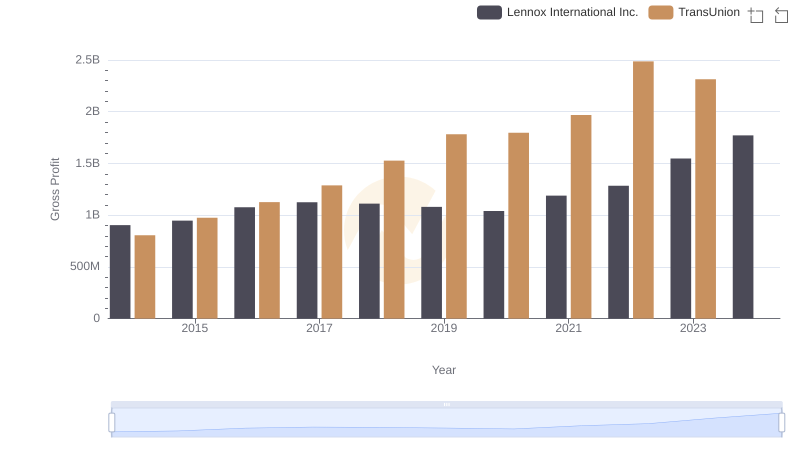
Gross Profit Trends Compared: Lennox International Inc. vs TransUnion
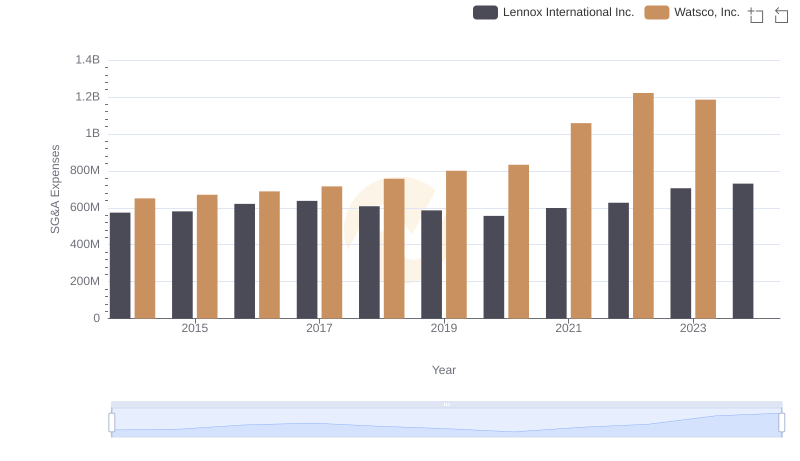
Operational Costs Compared: SG&A Analysis of Lennox International Inc. and Watsco, Inc.
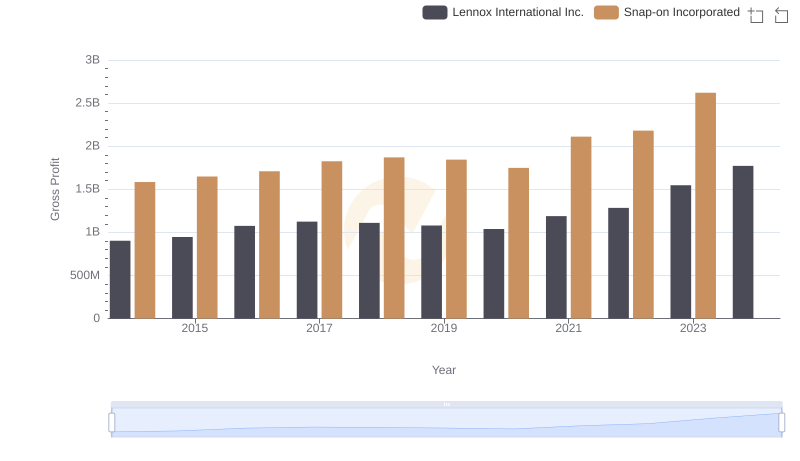
Lennox International Inc. vs Snap-on Incorporated: A Gross Profit Performance Breakdown
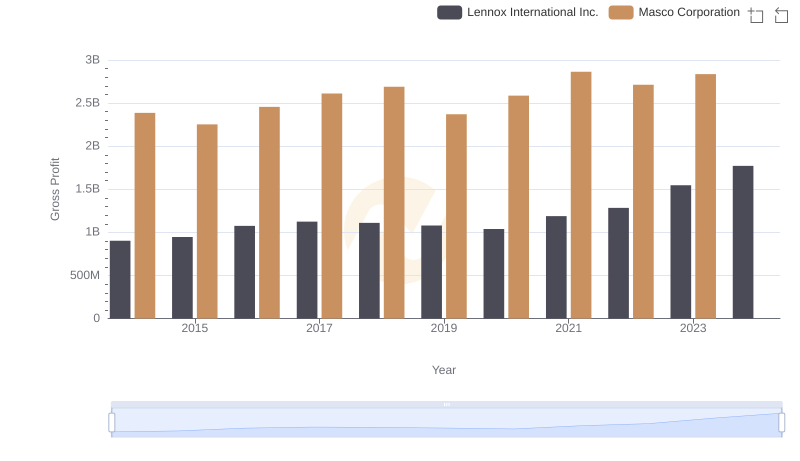
Gross Profit Trends Compared: Lennox International Inc. vs Masco Corporation
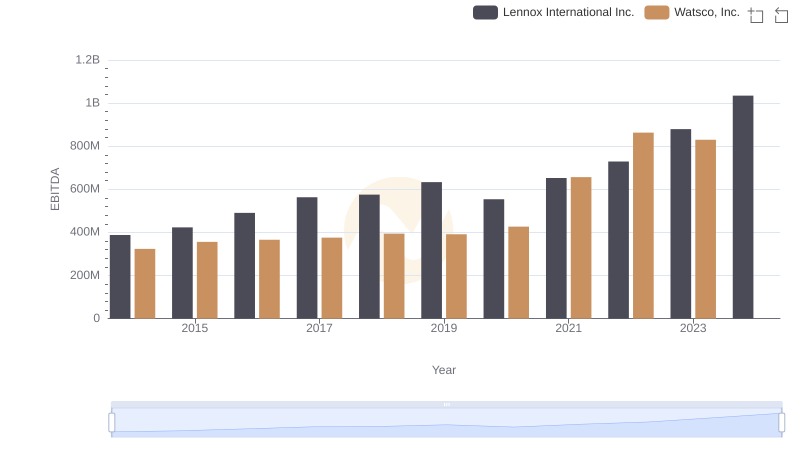
A Professional Review of EBITDA: Lennox International Inc. Compared to Watsco, Inc.