| __timestamp | Hubbell Incorporated | Lennox International Inc. |
|---|---|---|
| Wednesday, January 1, 2014 | 591600000 | 573700000 |
| Thursday, January 1, 2015 | 617200000 | 580500000 |
| Friday, January 1, 2016 | 622900000 | 621000000 |
| Sunday, January 1, 2017 | 648200000 | 637700000 |
| Monday, January 1, 2018 | 743500000 | 608200000 |
| Tuesday, January 1, 2019 | 756100000 | 585900000 |
| Wednesday, January 1, 2020 | 676300000 | 555900000 |
| Friday, January 1, 2021 | 619200000 | 598900000 |
| Saturday, January 1, 2022 | 762500000 | 627200000 |
| Sunday, January 1, 2023 | 848600000 | 705500000 |
| Monday, January 1, 2024 | 812500000 | 730600000 |
Data in motion
In the ever-evolving landscape of industrial manufacturing, understanding the financial dynamics of key players is crucial. Over the past decade, Lennox International Inc. and Hubbell Incorporated have showcased intriguing trends in their Selling, General, and Administrative (SG&A) expenses. From 2014 to 2023, Hubbell's SG&A expenses have surged by approximately 43%, peaking in 2023. In contrast, Lennox's expenses have grown by about 23% over the same period, with a notable increase in 2023. This divergence highlights differing strategic priorities and operational efficiencies. While Hubbell's expenses consistently outpaced Lennox's, the gap narrowed significantly in recent years, suggesting Lennox's aggressive cost management or strategic investments. Missing data for 2024 suggests a need for cautious interpretation, but the trends offer valuable insights into the financial strategies of these industrial giants.
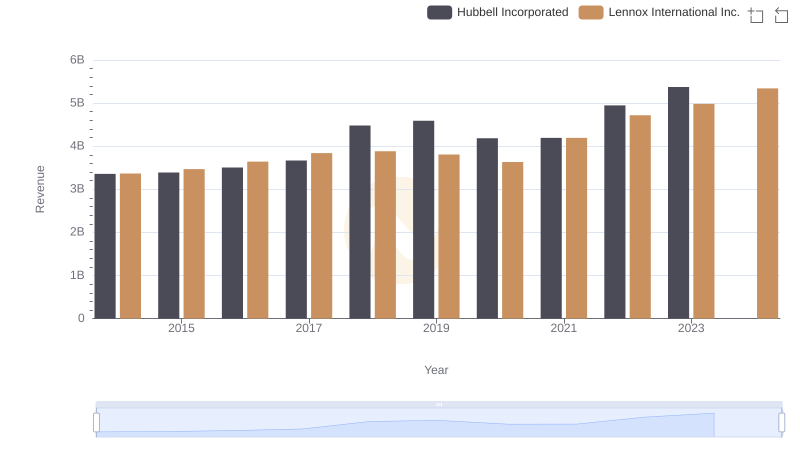
Revenue Showdown: Lennox International Inc. vs Hubbell Incorporated
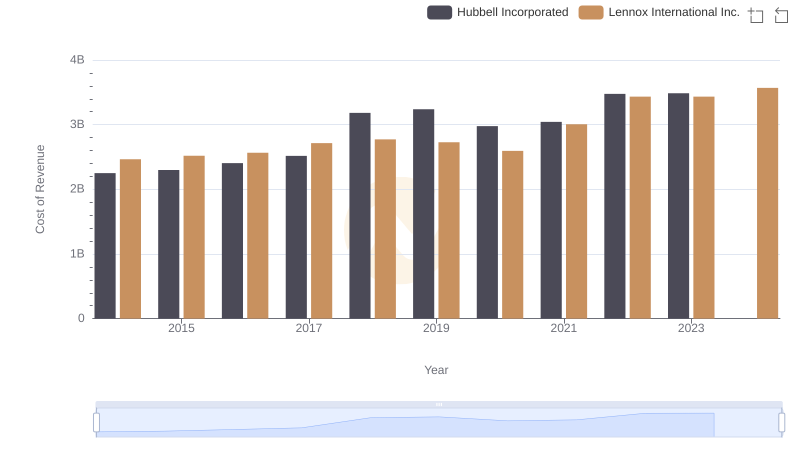
Cost of Revenue Comparison: Lennox International Inc. vs Hubbell Incorporated
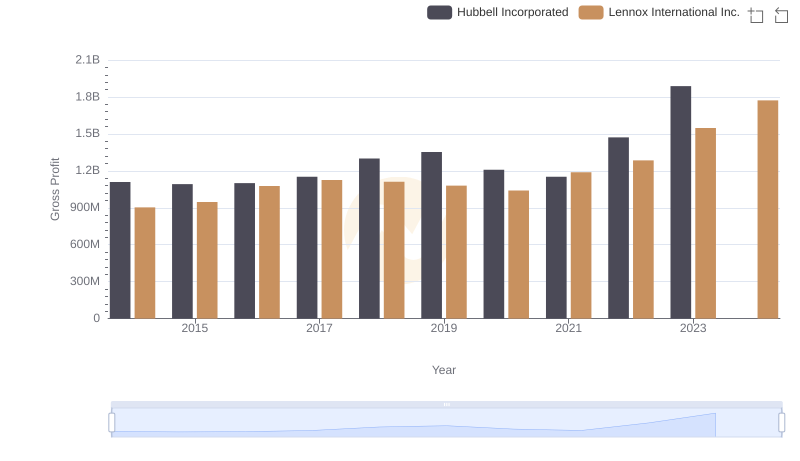
Key Insights on Gross Profit: Lennox International Inc. vs Hubbell Incorporated
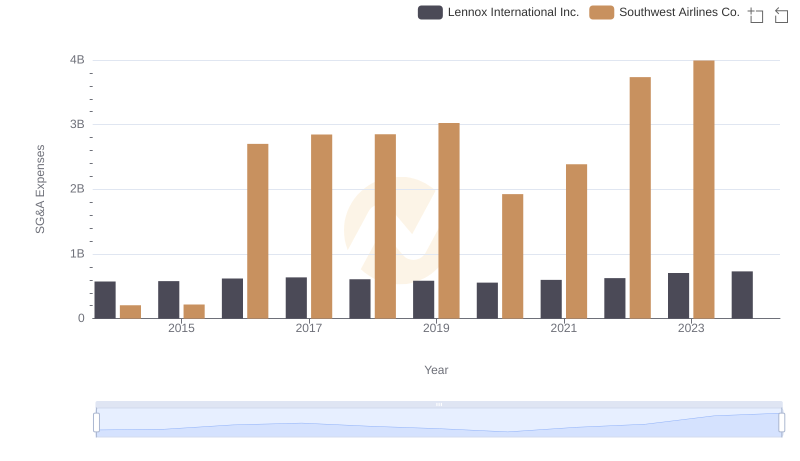
Cost Management Insights: SG&A Expenses for Lennox International Inc. and Southwest Airlines Co.
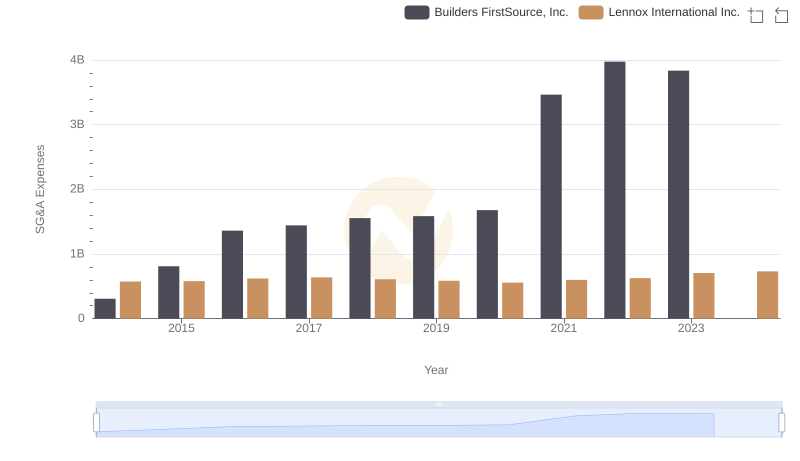
Lennox International Inc. or Builders FirstSource, Inc.: Who Manages SG&A Costs Better?
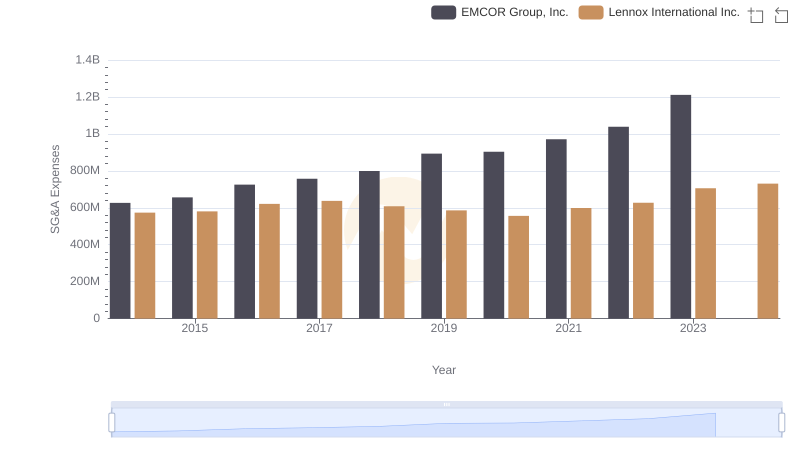
Who Optimizes SG&A Costs Better? Lennox International Inc. or EMCOR Group, Inc.
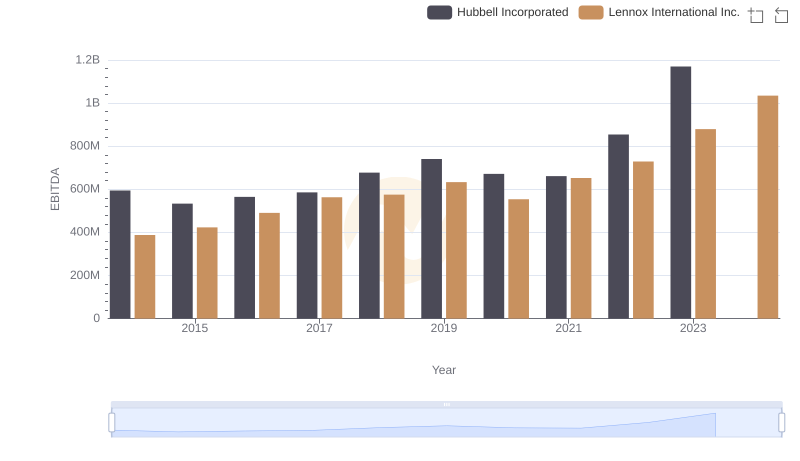
A Side-by-Side Analysis of EBITDA: Lennox International Inc. and Hubbell Incorporated
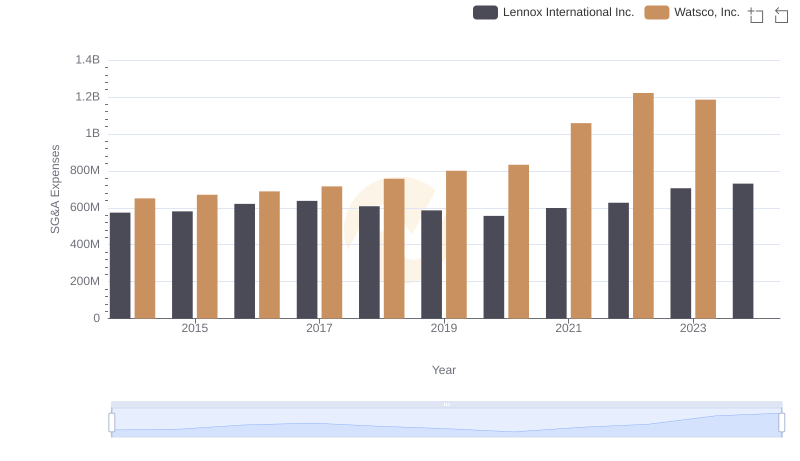
Operational Costs Compared: SG&A Analysis of Lennox International Inc. and Watsco, Inc.
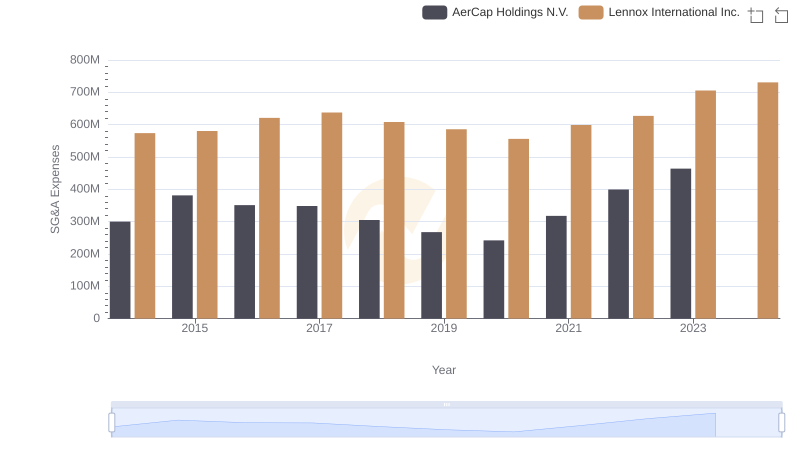
Operational Costs Compared: SG&A Analysis of Lennox International Inc. and AerCap Holdings N.V.
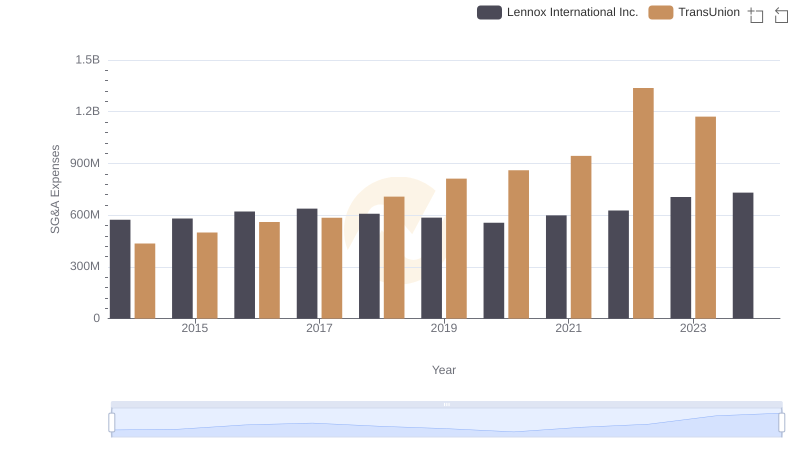
SG&A Efficiency Analysis: Comparing Lennox International Inc. and TransUnion
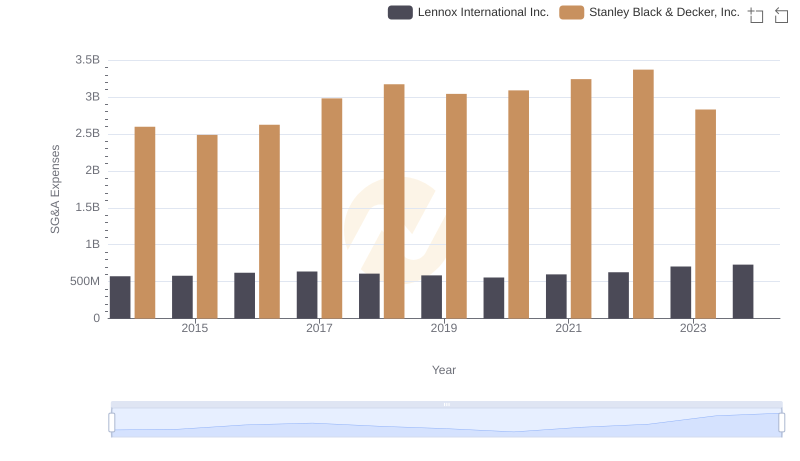
Who Optimizes SG&A Costs Better? Lennox International Inc. or Stanley Black & Decker, Inc.
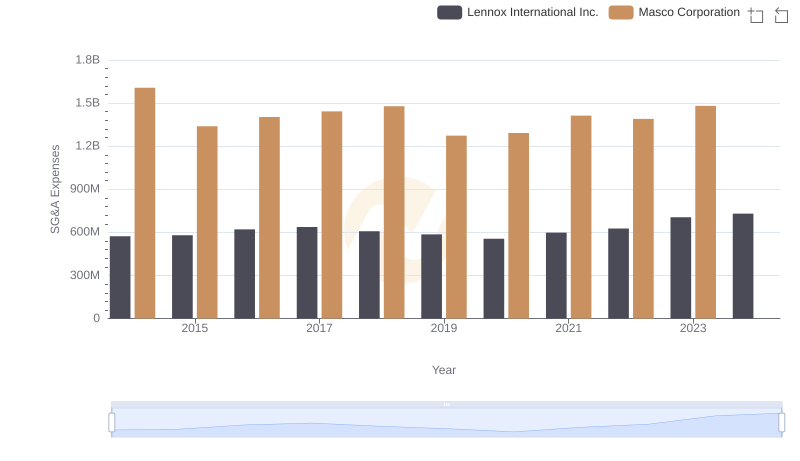
Lennox International Inc. or Masco Corporation: Who Manages SG&A Costs Better?