| __timestamp | Lennox International Inc. | TransUnion |
|---|---|---|
| Wednesday, January 1, 2014 | 903300000 | 805600000 |
| Thursday, January 1, 2015 | 947400000 | 975200000 |
| Friday, January 1, 2016 | 1076500000 | 1125800000 |
| Sunday, January 1, 2017 | 1125200000 | 1288100000 |
| Monday, January 1, 2018 | 1111200000 | 1527100000 |
| Tuesday, January 1, 2019 | 1079800000 | 1782000000 |
| Wednesday, January 1, 2020 | 1040100000 | 1796200000 |
| Friday, January 1, 2021 | 1188400000 | 1968600000 |
| Saturday, January 1, 2022 | 1284700000 | 2487000000 |
| Sunday, January 1, 2023 | 1547800000 | 2313900000 |
| Monday, January 1, 2024 | 1771900000 | 4183800000 |
Igniting the spark of knowledge
In the competitive landscape of American business, Lennox International Inc. and TransUnion have showcased intriguing gross profit trends over the past decade. From 2014 to 2023, Lennox International Inc. has seen a steady rise in gross profit, culminating in a remarkable 96% increase by 2023. Meanwhile, TransUnion's growth trajectory has been even more impressive, with a 187% surge in gross profit from 2014 to 2022. However, 2023 data for TransUnion is missing, leaving a gap in the narrative.
Lennox's consistent growth reflects its robust market strategies and adaptability, while TransUnion's rapid ascent underscores its dominance in the financial services sector. As we look to the future, these trends offer valuable insights into the evolving dynamics of these industry leaders. Stay tuned as we continue to track these financial titans and their impact on the market.
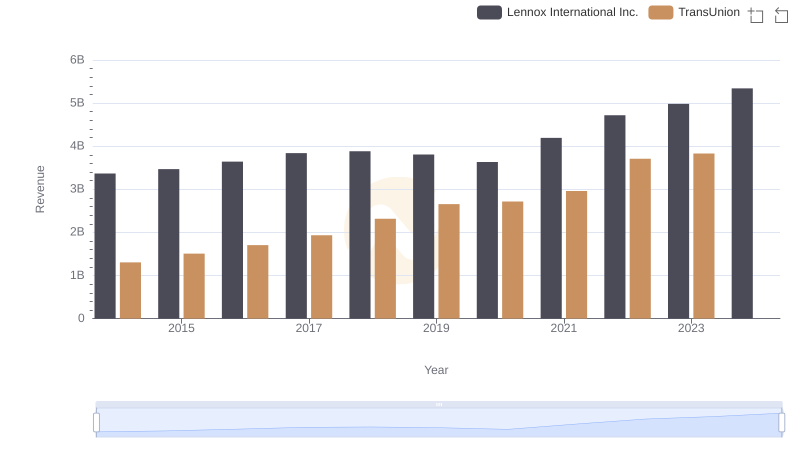
Lennox International Inc. vs TransUnion: Examining Key Revenue Metrics
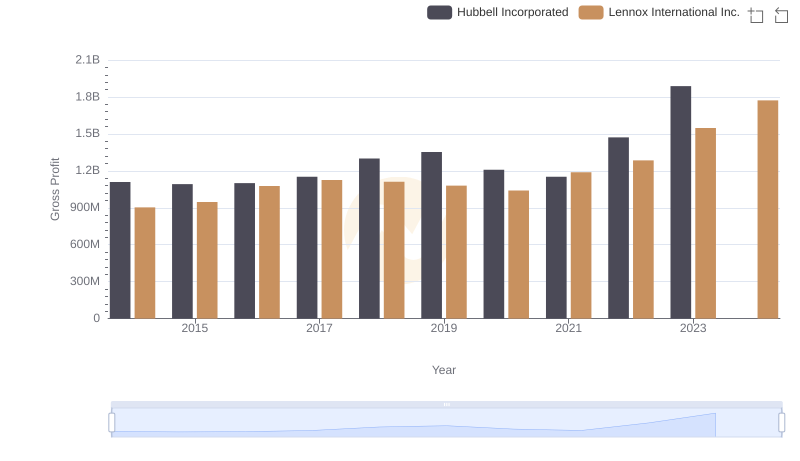
Key Insights on Gross Profit: Lennox International Inc. vs Hubbell Incorporated
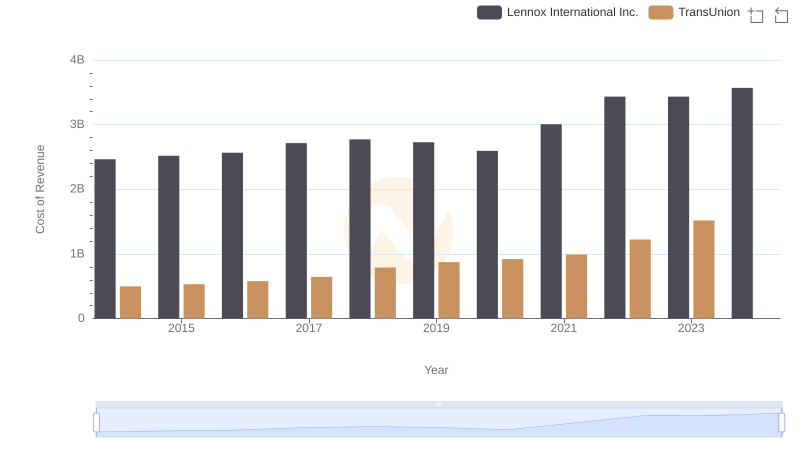
Comparing Cost of Revenue Efficiency: Lennox International Inc. vs TransUnion
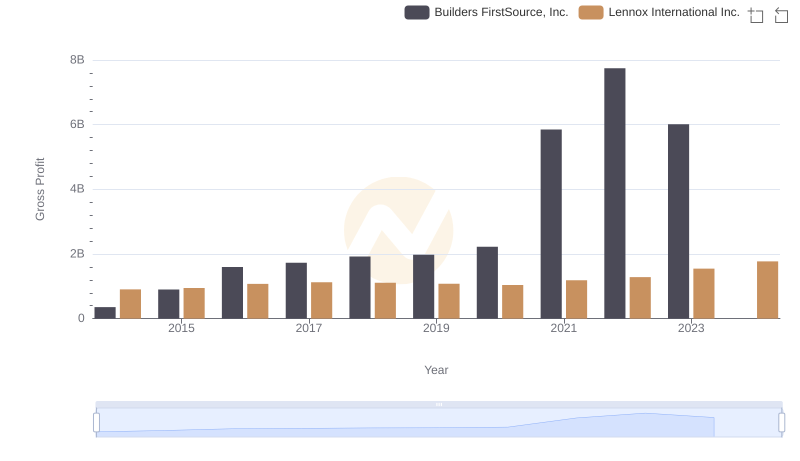
Gross Profit Trends Compared: Lennox International Inc. vs Builders FirstSource, Inc.
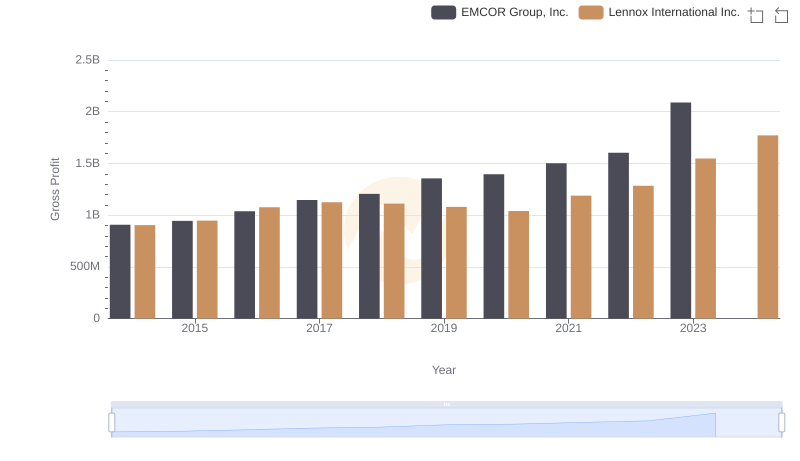
Gross Profit Trends Compared: Lennox International Inc. vs EMCOR Group, Inc.
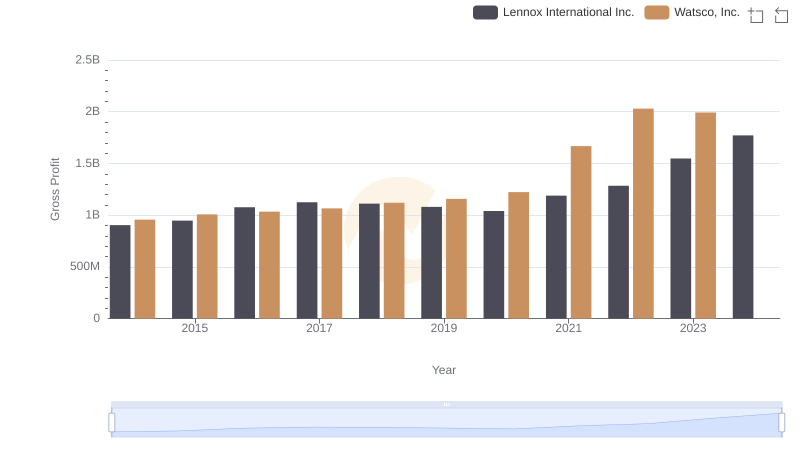
Lennox International Inc. and Watsco, Inc.: A Detailed Gross Profit Analysis
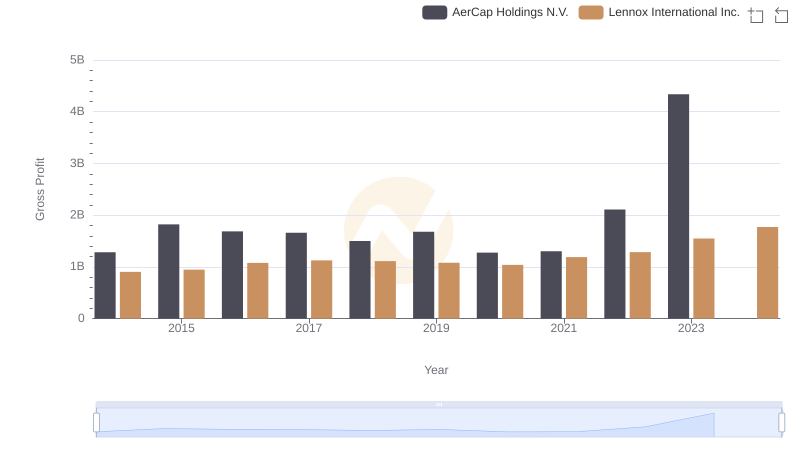
Gross Profit Trends Compared: Lennox International Inc. vs AerCap Holdings N.V.
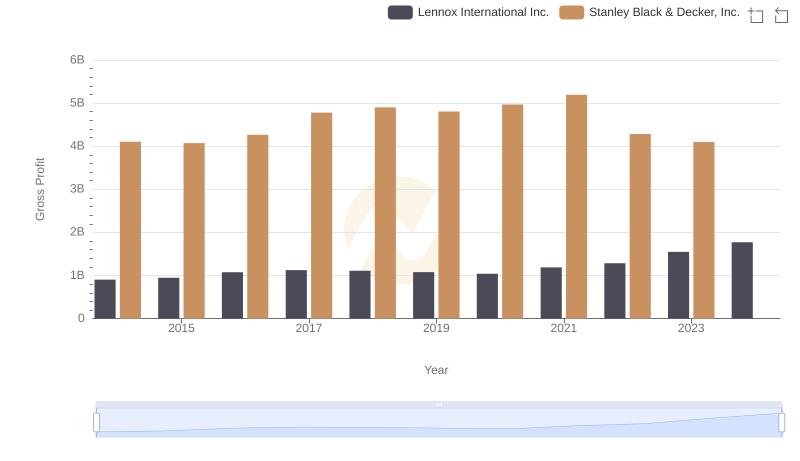
Key Insights on Gross Profit: Lennox International Inc. vs Stanley Black & Decker, Inc.
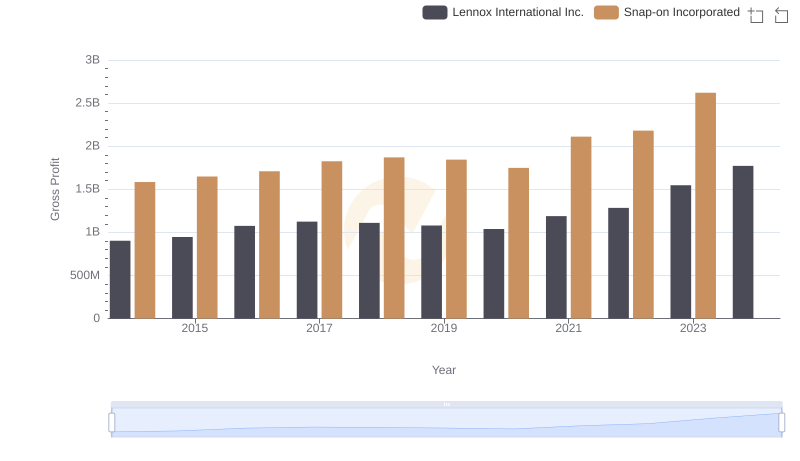
Lennox International Inc. vs Snap-on Incorporated: A Gross Profit Performance Breakdown
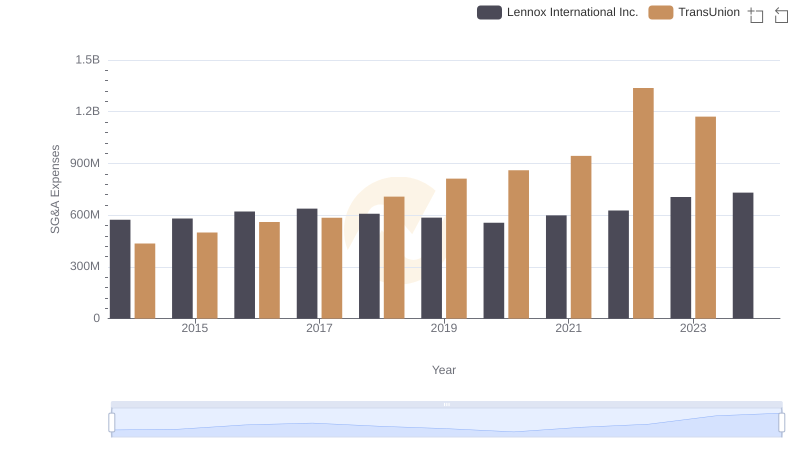
SG&A Efficiency Analysis: Comparing Lennox International Inc. and TransUnion
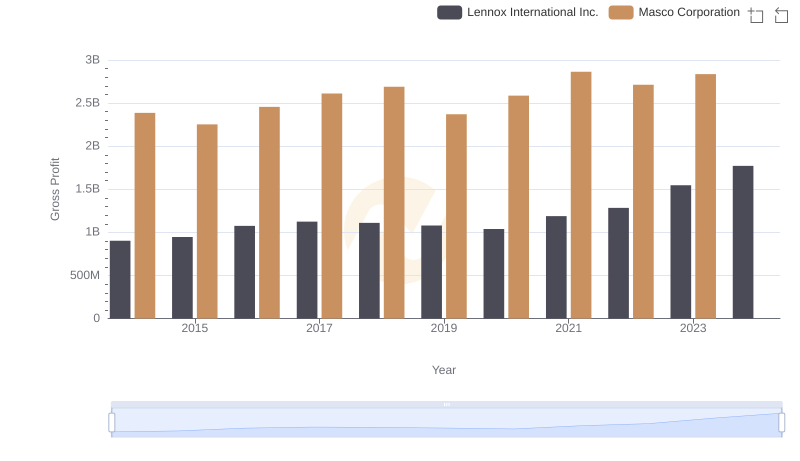
Gross Profit Trends Compared: Lennox International Inc. vs Masco Corporation
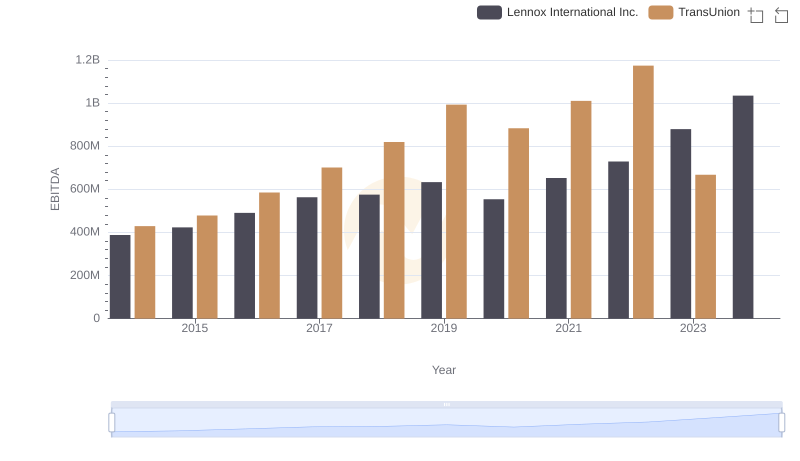
EBITDA Performance Review: Lennox International Inc. vs TransUnion