| __timestamp | Builders FirstSource, Inc. | Lennox International Inc. |
|---|---|---|
| Wednesday, January 1, 2014 | 356997000 | 903300000 |
| Thursday, January 1, 2015 | 901458000 | 947400000 |
| Friday, January 1, 2016 | 1596748000 | 1076500000 |
| Sunday, January 1, 2017 | 1727391000 | 1125200000 |
| Monday, January 1, 2018 | 1922940000 | 1111200000 |
| Tuesday, January 1, 2019 | 1976829000 | 1079800000 |
| Wednesday, January 1, 2020 | 2222584000 | 1040100000 |
| Friday, January 1, 2021 | 5850956000 | 1188400000 |
| Saturday, January 1, 2022 | 7744379000 | 1284700000 |
| Sunday, January 1, 2023 | 6012334000 | 1547800000 |
| Monday, January 1, 2024 | 1771900000 |
Unleashing insights
In the competitive landscape of the building materials industry, Lennox International Inc. and Builders FirstSource, Inc. have showcased intriguing gross profit trends over the past decade. From 2014 to 2023, Builders FirstSource, Inc. experienced a staggering growth of over 1,500%, peaking in 2022. This remarkable surge highlights their strategic market positioning and operational efficiency. In contrast, Lennox International Inc. demonstrated a steady increase, with a 71% rise in gross profit from 2014 to 2023, reflecting consistent performance and resilience.
These trends underscore the dynamic nature of the industry and the varying strategies employed by these two giants.
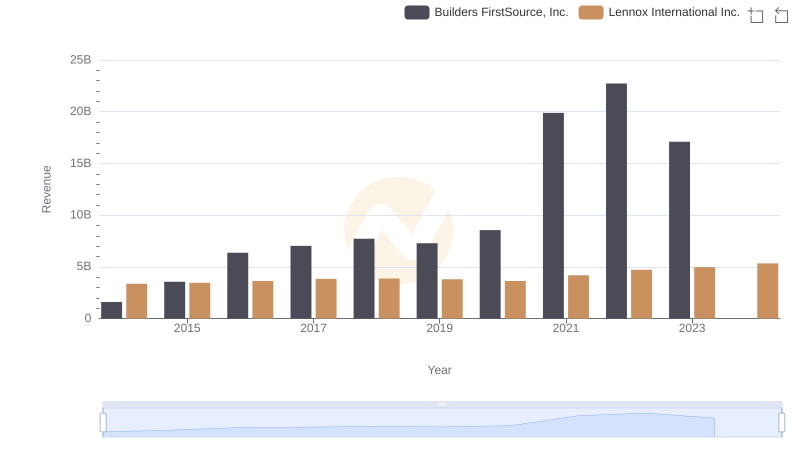
Lennox International Inc. and Builders FirstSource, Inc.: A Comprehensive Revenue Analysis
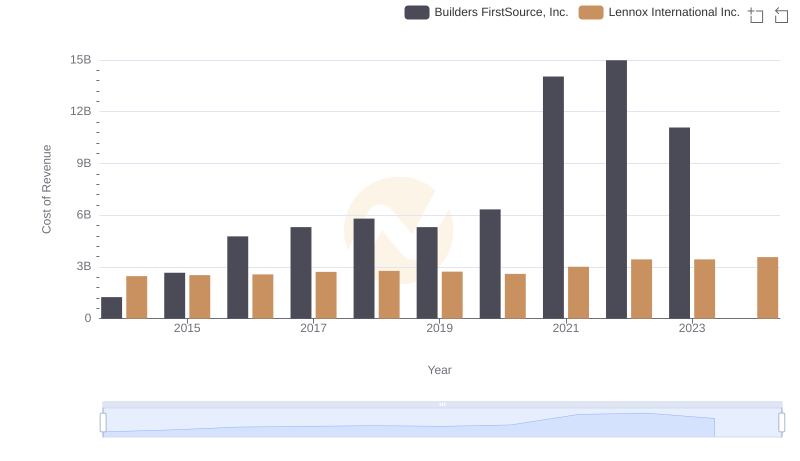
Cost Insights: Breaking Down Lennox International Inc. and Builders FirstSource, Inc.'s Expenses
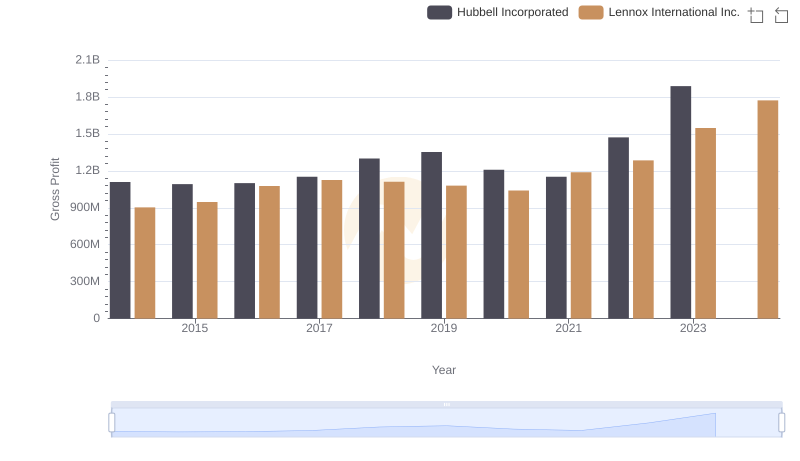
Key Insights on Gross Profit: Lennox International Inc. vs Hubbell Incorporated
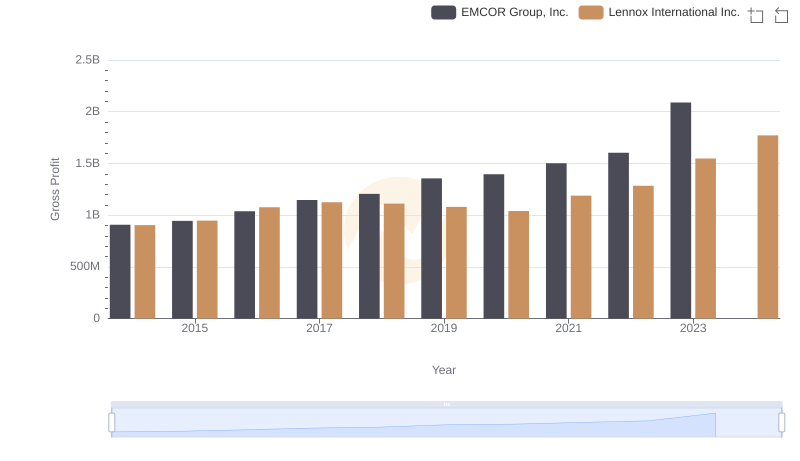
Gross Profit Trends Compared: Lennox International Inc. vs EMCOR Group, Inc.
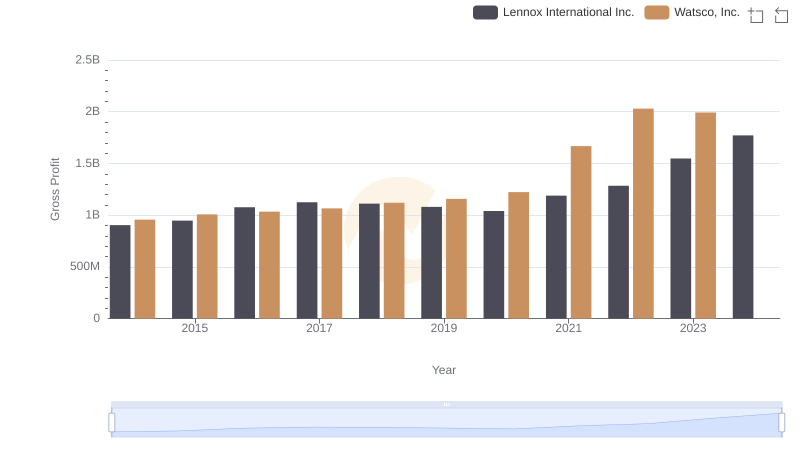
Lennox International Inc. and Watsco, Inc.: A Detailed Gross Profit Analysis
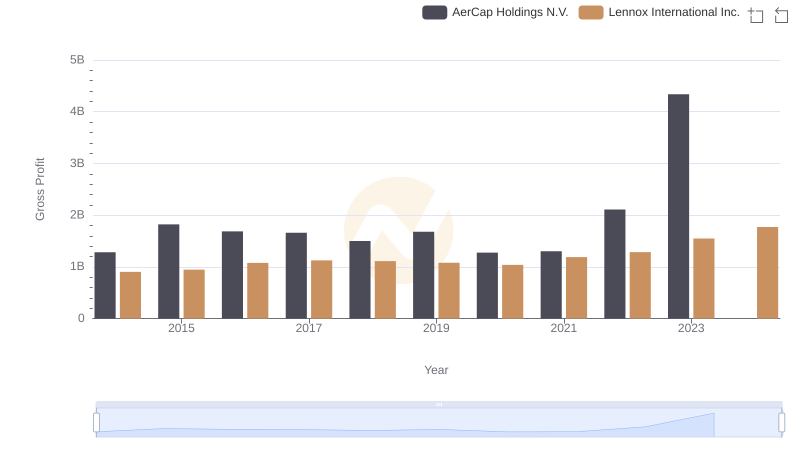
Gross Profit Trends Compared: Lennox International Inc. vs AerCap Holdings N.V.
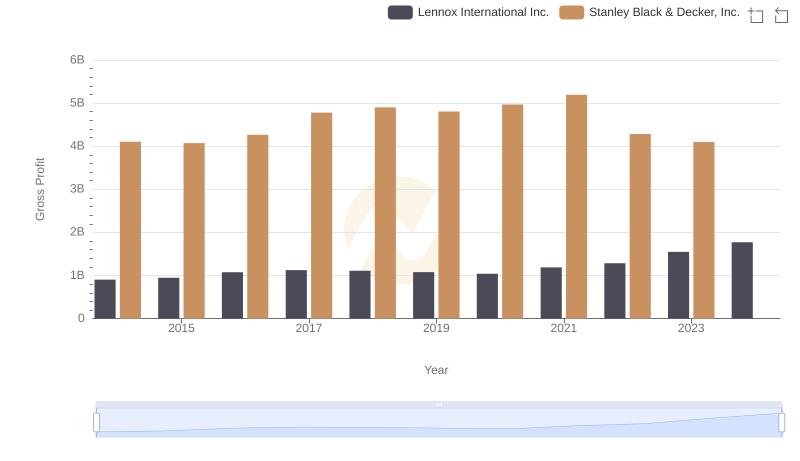
Key Insights on Gross Profit: Lennox International Inc. vs Stanley Black & Decker, Inc.
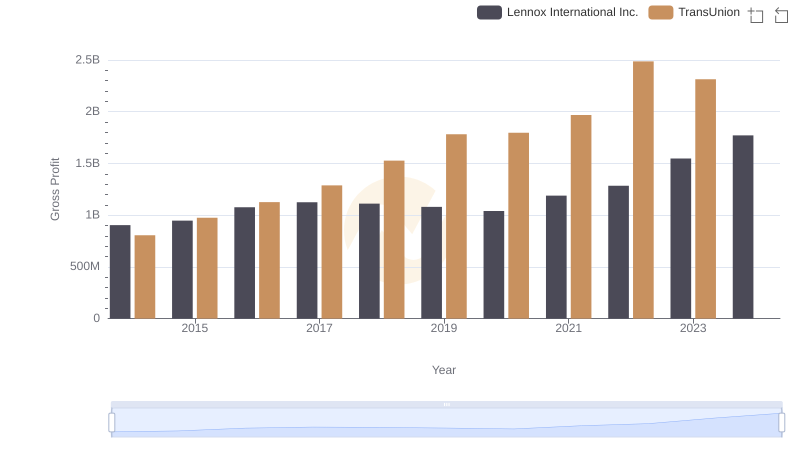
Gross Profit Trends Compared: Lennox International Inc. vs TransUnion
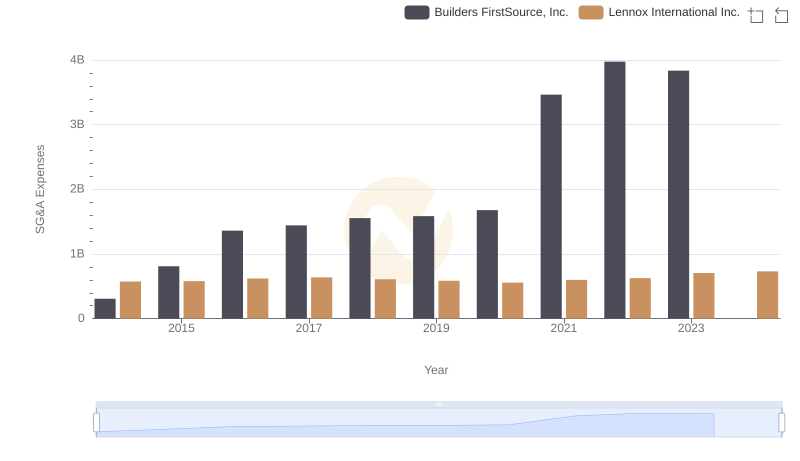
Lennox International Inc. or Builders FirstSource, Inc.: Who Manages SG&A Costs Better?
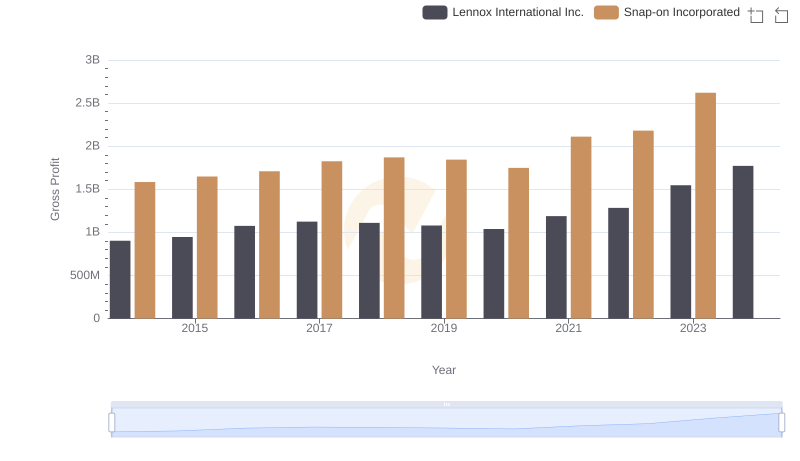
Lennox International Inc. vs Snap-on Incorporated: A Gross Profit Performance Breakdown
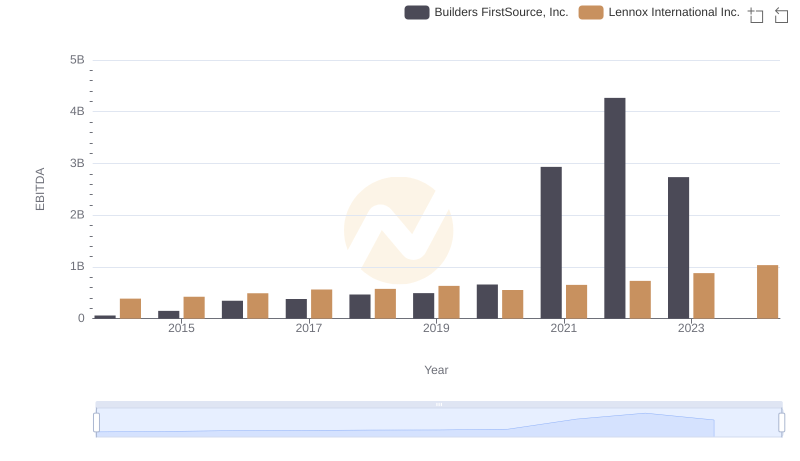
A Professional Review of EBITDA: Lennox International Inc. Compared to Builders FirstSource, Inc.
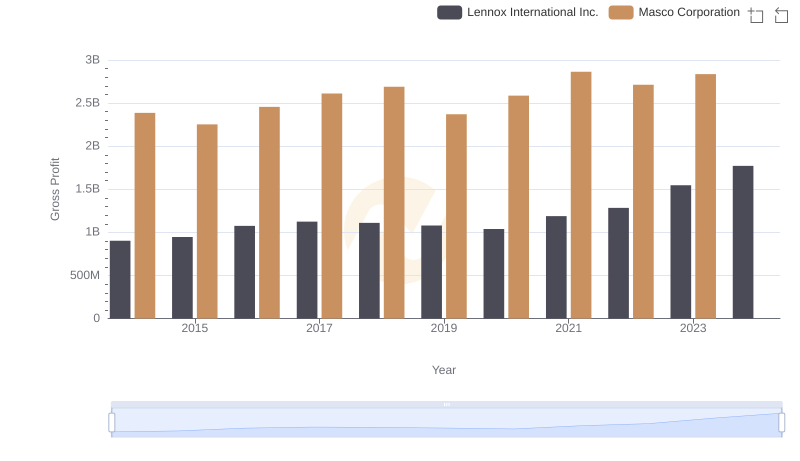
Gross Profit Trends Compared: Lennox International Inc. vs Masco Corporation