| __timestamp | Lennox International Inc. | Stanley Black & Decker, Inc. |
|---|---|---|
| Wednesday, January 1, 2014 | 903300000 | 4102700000 |
| Thursday, January 1, 2015 | 947400000 | 4072000000 |
| Friday, January 1, 2016 | 1076500000 | 4267200000 |
| Sunday, January 1, 2017 | 1125200000 | 4778000000 |
| Monday, January 1, 2018 | 1111200000 | 4901900000 |
| Tuesday, January 1, 2019 | 1079800000 | 4805500000 |
| Wednesday, January 1, 2020 | 1040100000 | 4967900000 |
| Friday, January 1, 2021 | 1188400000 | 5194200000 |
| Saturday, January 1, 2022 | 1284700000 | 4284100000 |
| Sunday, January 1, 2023 | 1547800000 | 4098000000 |
| Monday, January 1, 2024 | 1771900000 | 4514400000 |
Unlocking the unknown
In the competitive landscape of industrial manufacturing, understanding financial performance is crucial. This analysis delves into the gross profit trends of Lennox International Inc. and Stanley Black & Decker, Inc. from 2014 to 2023. Over this decade, Lennox International Inc. has shown a remarkable upward trajectory, with gross profit increasing by approximately 96%, from $903 million in 2014 to an impressive $1.77 billion in 2023. In contrast, Stanley Black & Decker, Inc. experienced fluctuations, peaking in 2021 with a gross profit of $5.19 billion, before declining to $4.10 billion in 2023. This divergence highlights Lennox's consistent growth strategy, while Stanley Black & Decker faces challenges in maintaining its profit margins. Notably, data for 2024 is missing for Stanley Black & Decker, indicating potential reporting delays or strategic shifts.

Lennox International Inc. vs Stanley Black & Decker, Inc.: Annual Revenue Growth Compared
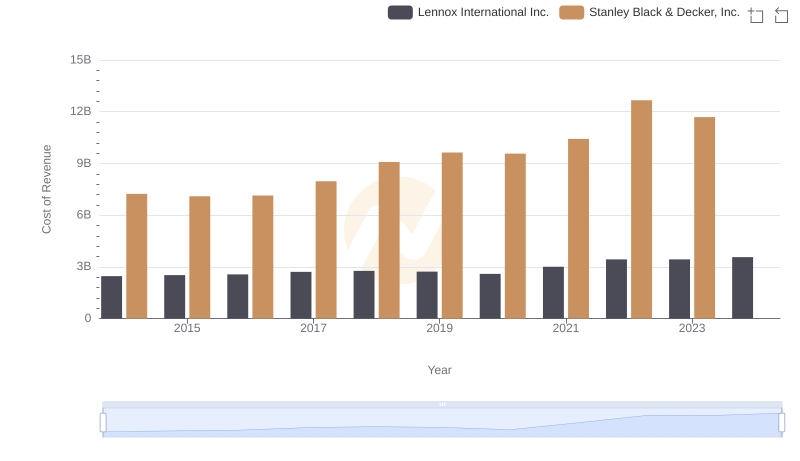
Lennox International Inc. vs Stanley Black & Decker, Inc.: Efficiency in Cost of Revenue Explored
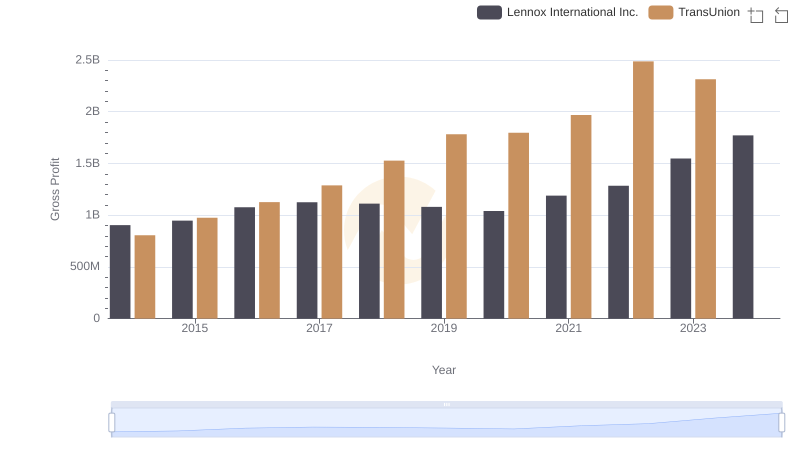
Gross Profit Trends Compared: Lennox International Inc. vs TransUnion
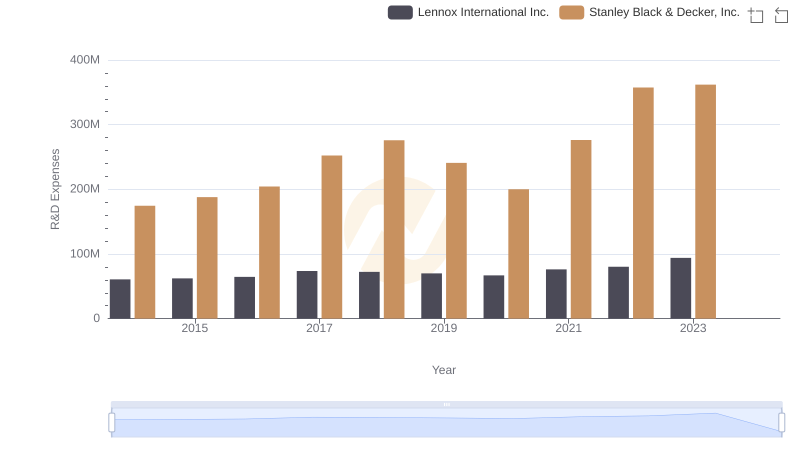
Research and Development Expenses Breakdown: Lennox International Inc. vs Stanley Black & Decker, Inc.
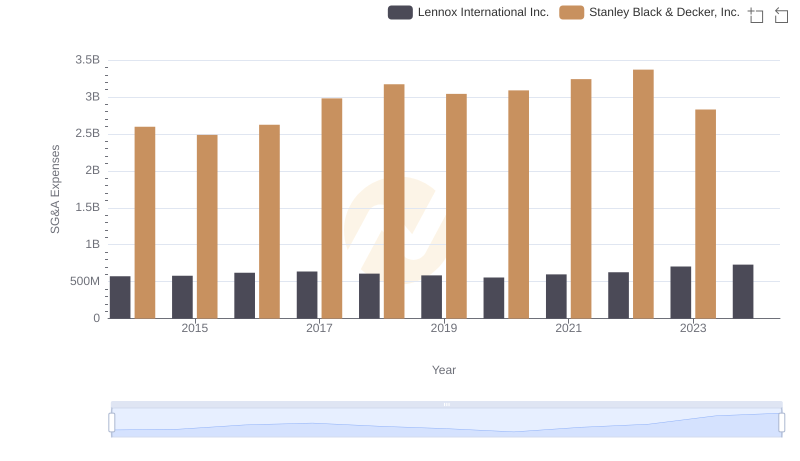
Who Optimizes SG&A Costs Better? Lennox International Inc. or Stanley Black & Decker, Inc.

A Professional Review of EBITDA: Lennox International Inc. Compared to Stanley Black & Decker, Inc.
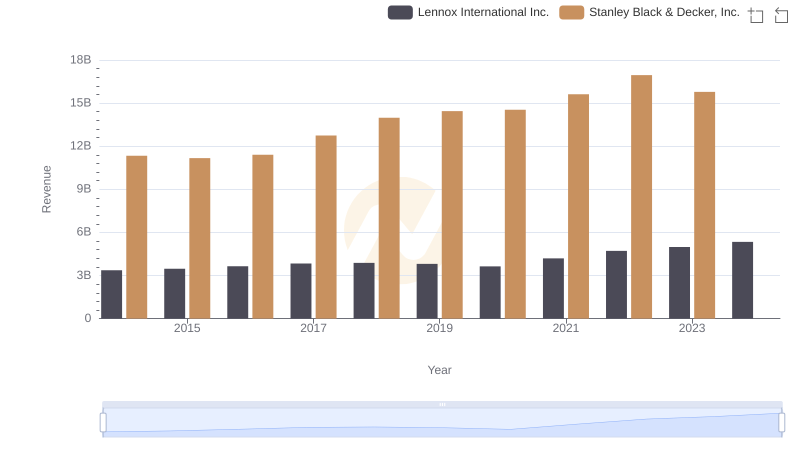
Lennox International Inc. and Stanley Black & Decker, Inc.: A Comprehensive Revenue Analysis

Analyzing Cost of Revenue: Lennox International Inc. and Stanley Black & Decker, Inc.
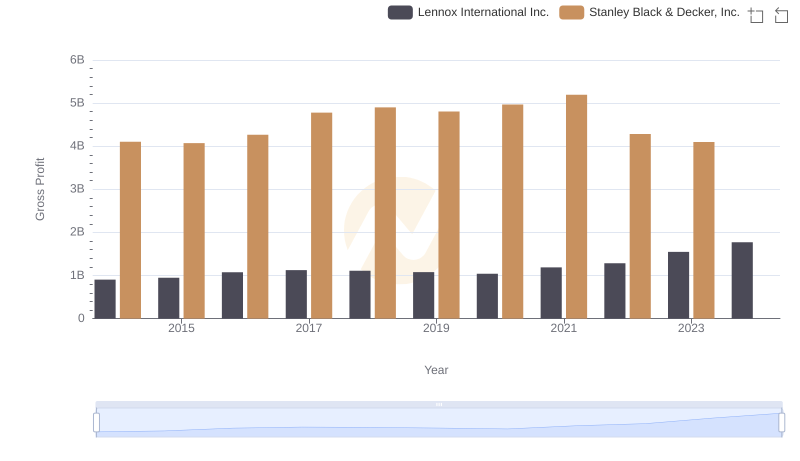
Lennox International Inc. vs Stanley Black & Decker, Inc.: A Gross Profit Performance Breakdown

Research and Development: Comparing Key Metrics for Lennox International Inc. and Stanley Black & Decker, Inc.

Comparing SG&A Expenses: Lennox International Inc. vs Stanley Black & Decker, Inc. Trends and Insights

Professional EBITDA Benchmarking: Lennox International Inc. vs Stanley Black & Decker, Inc.