| __timestamp | Hubbell Incorporated | Lennox International Inc. |
|---|---|---|
| Wednesday, January 1, 2014 | 594700000 | 387700000 |
| Thursday, January 1, 2015 | 533600000 | 423600000 |
| Friday, January 1, 2016 | 564700000 | 490800000 |
| Sunday, January 1, 2017 | 585600000 | 562900000 |
| Monday, January 1, 2018 | 677500000 | 575200000 |
| Tuesday, January 1, 2019 | 740900000 | 633300000 |
| Wednesday, January 1, 2020 | 671400000 | 553900000 |
| Friday, January 1, 2021 | 661000000 | 652500000 |
| Saturday, January 1, 2022 | 854300000 | 729000000 |
| Sunday, January 1, 2023 | 1169700000 | 879500000 |
| Monday, January 1, 2024 | 1291200000 | 1034800000 |
Unlocking the unknown
In the ever-evolving landscape of industrial manufacturing, understanding financial performance is crucial. This analysis delves into the EBITDA trends of Lennox International Inc. and Hubbell Incorporated from 2014 to 2023. Over this period, Hubbell Incorporated demonstrated a robust growth trajectory, with EBITDA increasing by approximately 97%, peaking at $1.17 billion in 2023. In contrast, Lennox International Inc. showed a steady rise, with a notable 127% increase, reaching $879 million in 2023.
The data reveals that while both companies have shown resilience, Lennox International Inc. experienced a more consistent upward trend, particularly from 2021 onwards. This could be attributed to strategic investments and market expansion. However, the absence of data for Hubbell in 2024 suggests potential volatility or reporting delays. As the industrial sector continues to adapt, these insights provide a valuable lens into the financial health and strategic direction of these industry leaders.
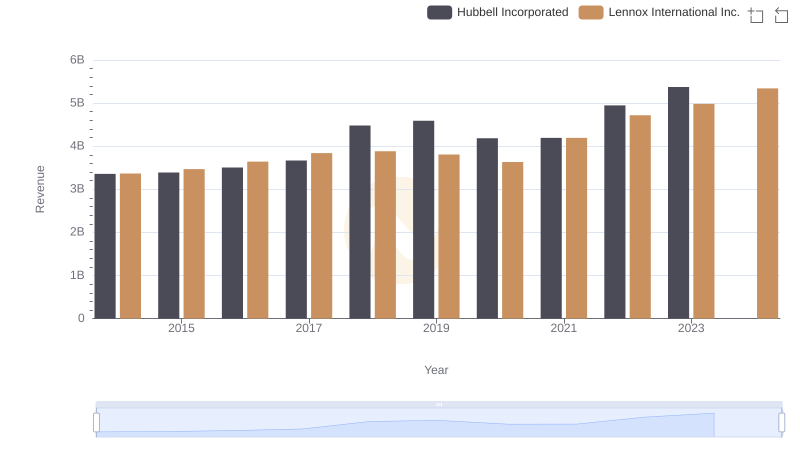
Revenue Showdown: Lennox International Inc. vs Hubbell Incorporated
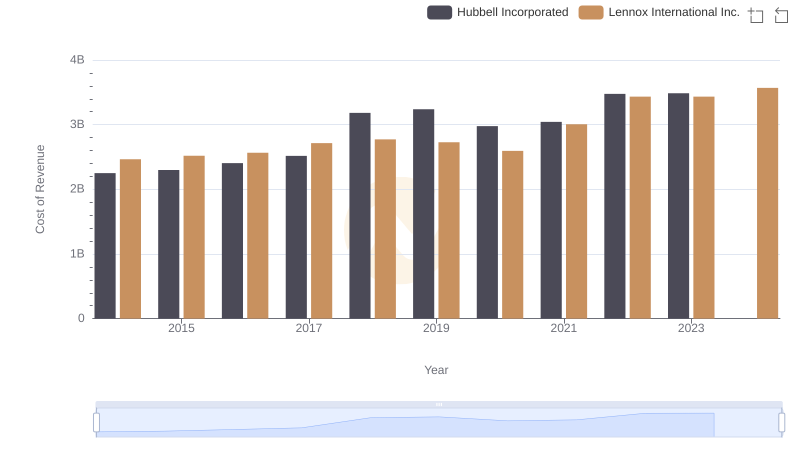
Cost of Revenue Comparison: Lennox International Inc. vs Hubbell Incorporated
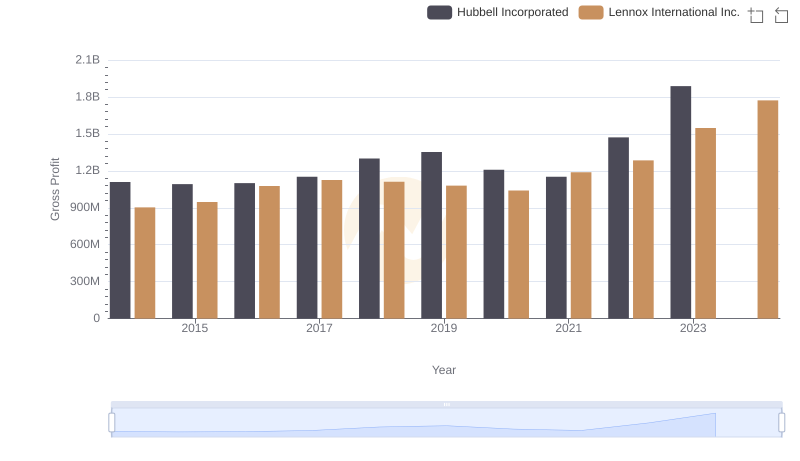
Key Insights on Gross Profit: Lennox International Inc. vs Hubbell Incorporated
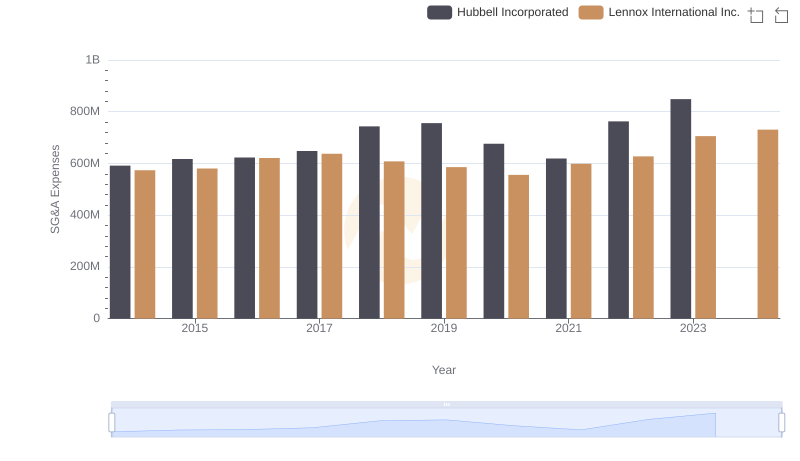
Breaking Down SG&A Expenses: Lennox International Inc. vs Hubbell Incorporated
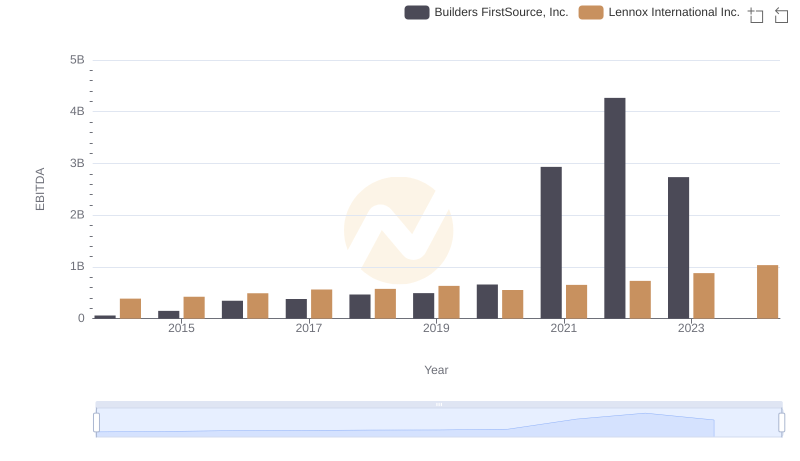
A Professional Review of EBITDA: Lennox International Inc. Compared to Builders FirstSource, Inc.
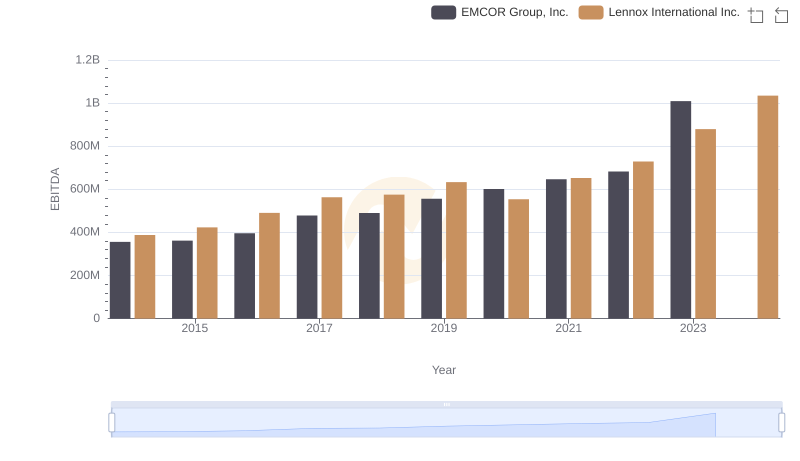
Lennox International Inc. vs EMCOR Group, Inc.: In-Depth EBITDA Performance Comparison
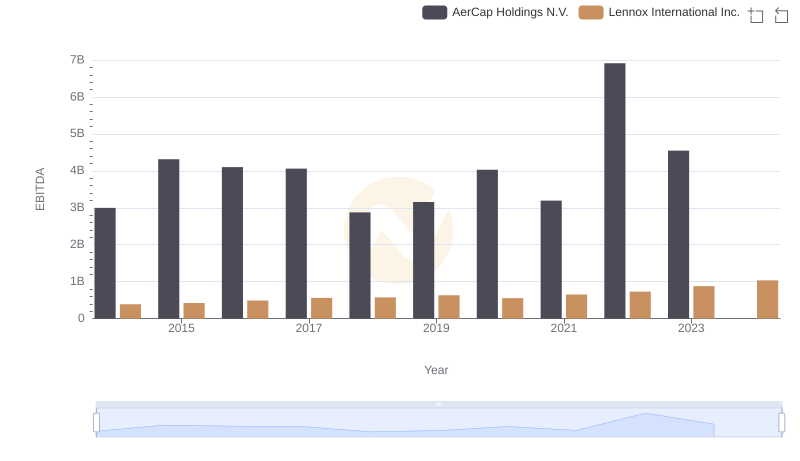
EBITDA Analysis: Evaluating Lennox International Inc. Against AerCap Holdings N.V.
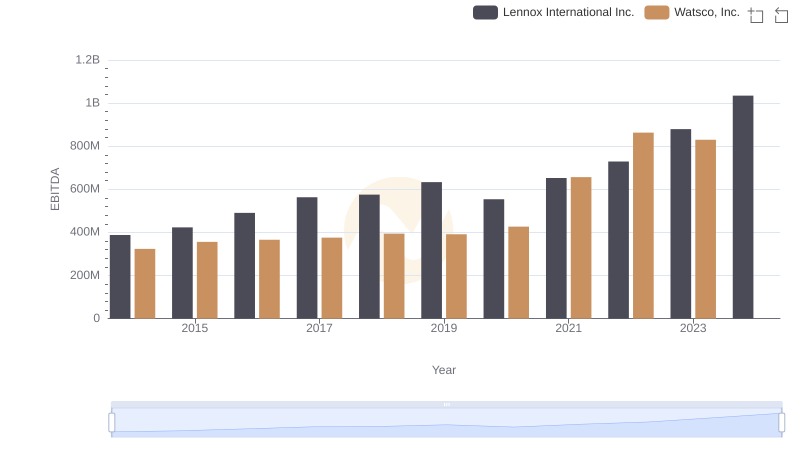
A Professional Review of EBITDA: Lennox International Inc. Compared to Watsco, Inc.
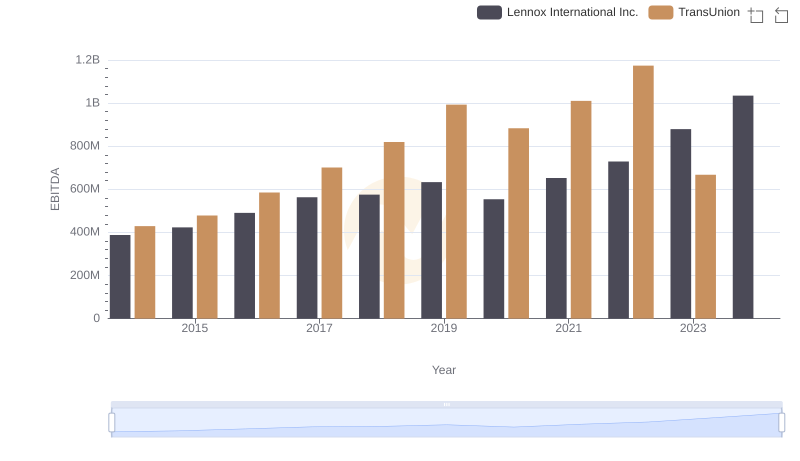
EBITDA Performance Review: Lennox International Inc. vs TransUnion

A Professional Review of EBITDA: Lennox International Inc. Compared to Stanley Black & Decker, Inc.
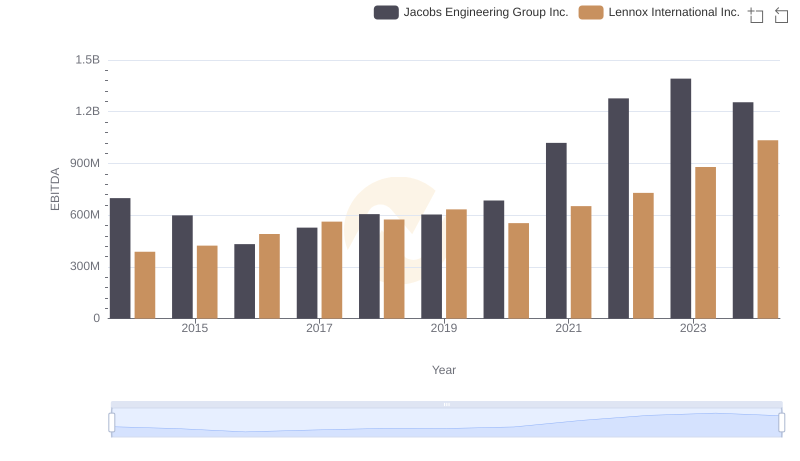
Lennox International Inc. and Jacobs Engineering Group Inc.: A Detailed Examination of EBITDA Performance
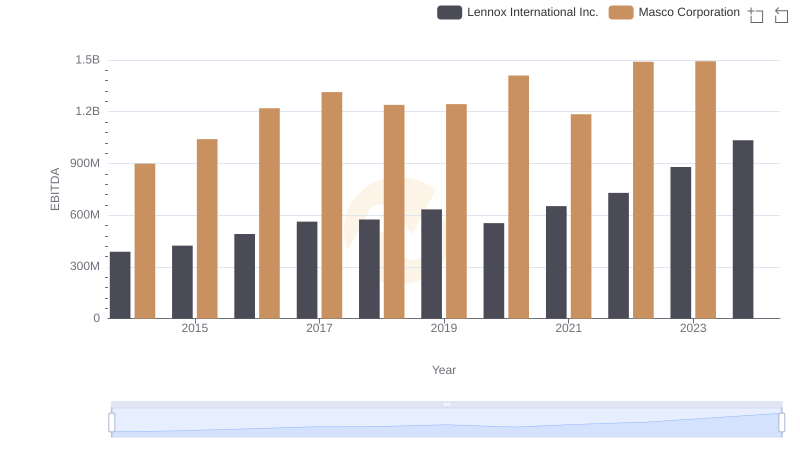
Comprehensive EBITDA Comparison: Lennox International Inc. vs Masco Corporation