| __timestamp | Hubbell Incorporated | Lennox International Inc. |
|---|---|---|
| Wednesday, January 1, 2014 | 3359400000 | 3367400000 |
| Thursday, January 1, 2015 | 3390400000 | 3467400000 |
| Friday, January 1, 2016 | 3505200000 | 3641600000 |
| Sunday, January 1, 2017 | 3668800000 | 3839600000 |
| Monday, January 1, 2018 | 4481700000 | 3883900000 |
| Tuesday, January 1, 2019 | 4591000000 | 3807200000 |
| Wednesday, January 1, 2020 | 4186000000 | 3634100000 |
| Friday, January 1, 2021 | 4194100000 | 4194100000 |
| Saturday, January 1, 2022 | 4947900000 | 4718400000 |
| Sunday, January 1, 2023 | 5372900000 | 4981900000 |
| Monday, January 1, 2024 | 5628500000 | 5341300000 |
Igniting the spark of knowledge
In the competitive landscape of the HVAC and electrical industries, Lennox International Inc. and Hubbell Incorporated have been key players. Over the past decade, from 2014 to 2023, these companies have demonstrated significant revenue growth, reflecting their resilience and strategic prowess.
Lennox International Inc. has shown a steady increase in revenue, with a notable 48% growth from 2014 to 2023. Meanwhile, Hubbell Incorporated has not lagged, boasting a 60% increase in the same period. The year 2023 marked a high point for both companies, with Hubbell reaching its peak revenue, surpassing Lennox by approximately 8%.
While Lennox's data extends into 2024, Hubbell's figures for that year remain elusive, leaving room for speculation on its future trajectory. As these industry giants continue to innovate, their financial performances will be closely watched by investors and analysts alike.
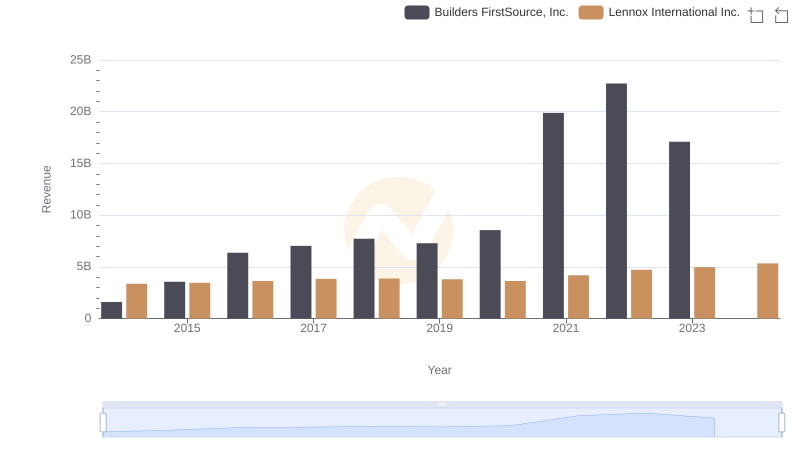
Lennox International Inc. and Builders FirstSource, Inc.: A Comprehensive Revenue Analysis
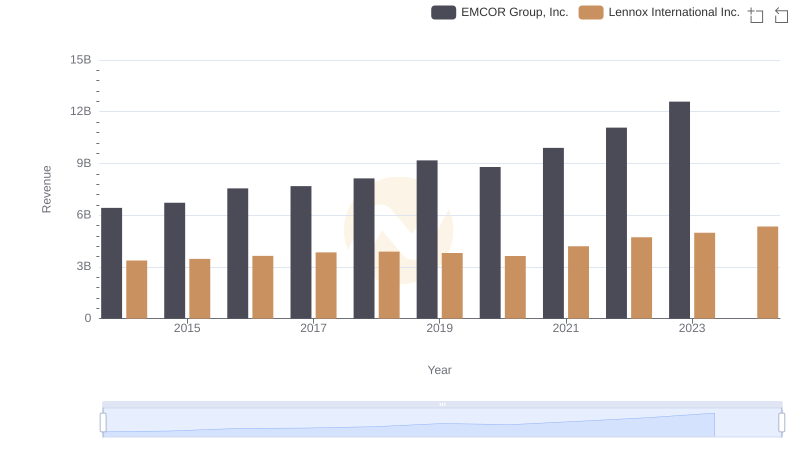
Who Generates More Revenue? Lennox International Inc. or EMCOR Group, Inc.
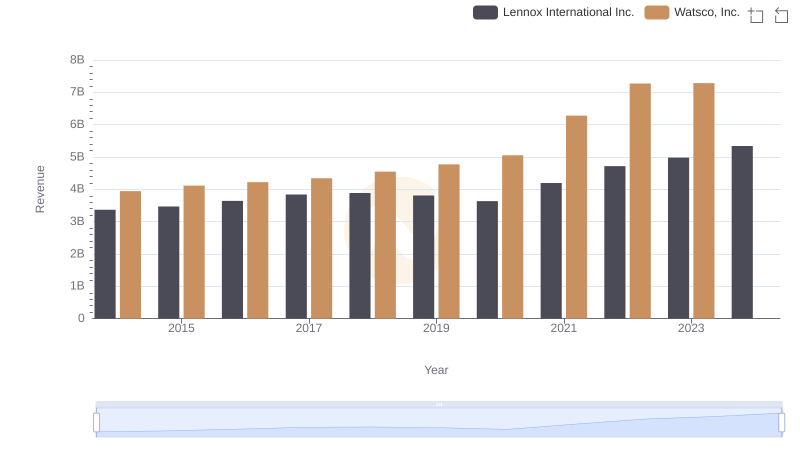
Comparing Revenue Performance: Lennox International Inc. or Watsco, Inc.?
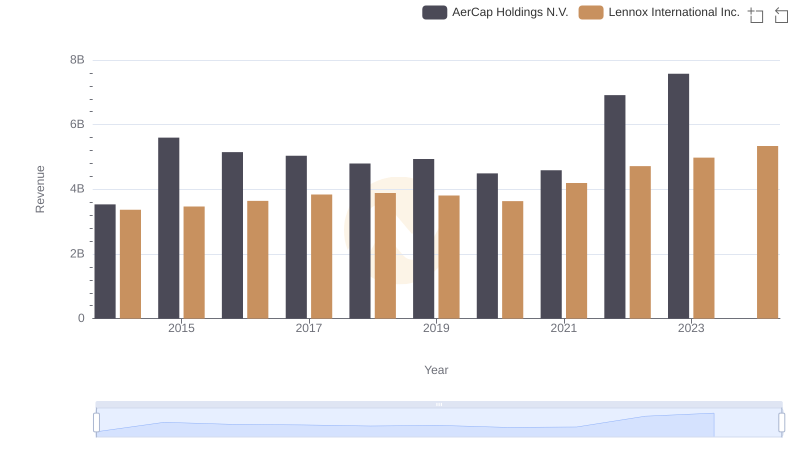
Annual Revenue Comparison: Lennox International Inc. vs AerCap Holdings N.V.
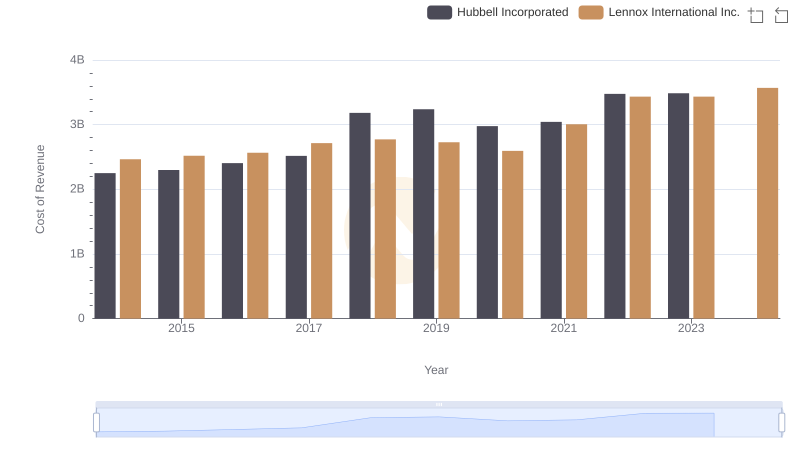
Cost of Revenue Comparison: Lennox International Inc. vs Hubbell Incorporated
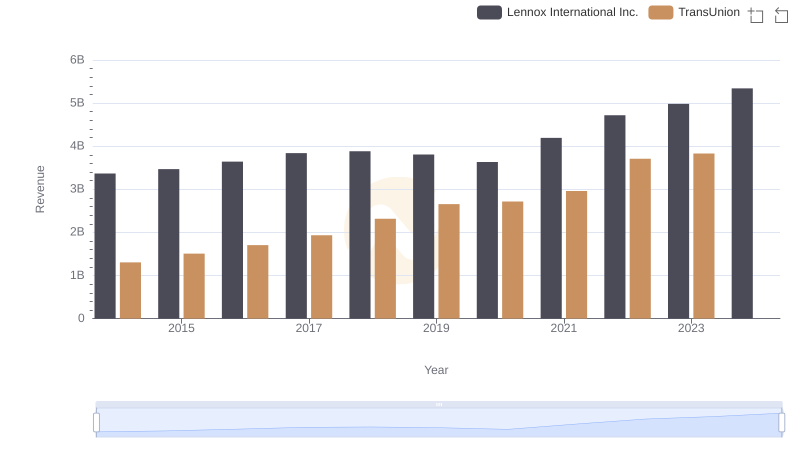
Lennox International Inc. vs TransUnion: Examining Key Revenue Metrics
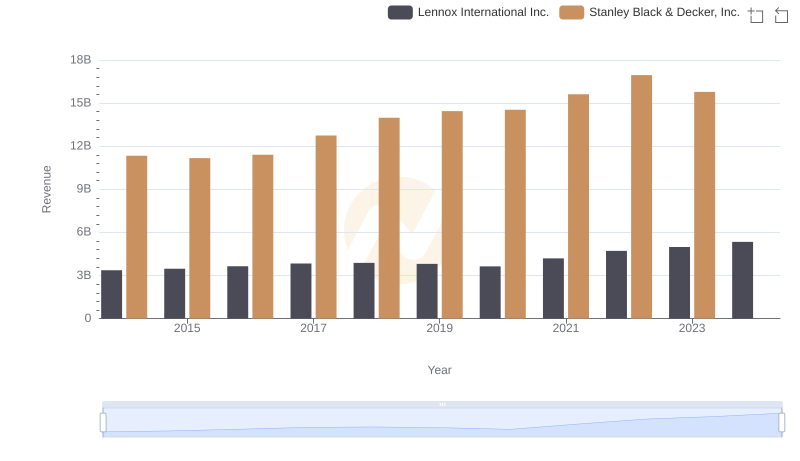
Lennox International Inc. vs Stanley Black & Decker, Inc.: Annual Revenue Growth Compared
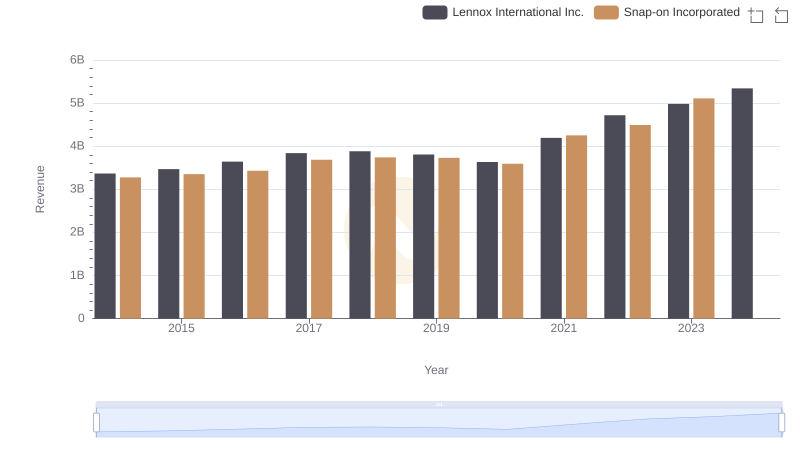
Lennox International Inc. vs Snap-on Incorporated: Examining Key Revenue Metrics
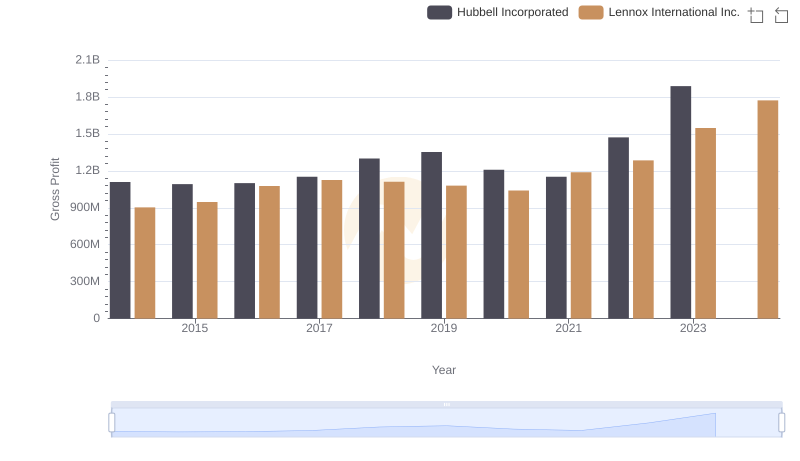
Key Insights on Gross Profit: Lennox International Inc. vs Hubbell Incorporated
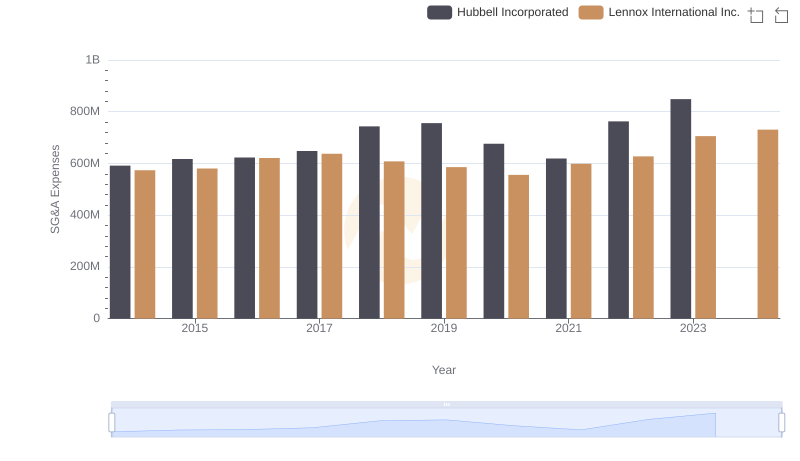
Breaking Down SG&A Expenses: Lennox International Inc. vs Hubbell Incorporated
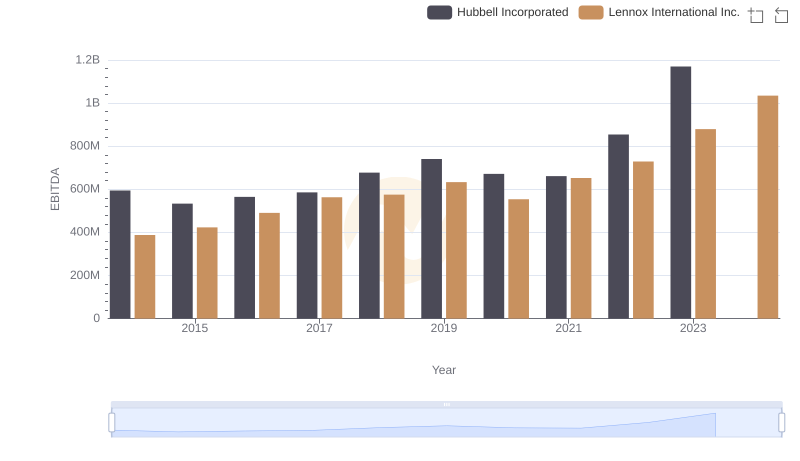
A Side-by-Side Analysis of EBITDA: Lennox International Inc. and Hubbell Incorporated