| __timestamp | Lennox International Inc. | Masco Corporation |
|---|---|---|
| Wednesday, January 1, 2014 | 903300000 | 2387000000 |
| Thursday, January 1, 2015 | 947400000 | 2253000000 |
| Friday, January 1, 2016 | 1076500000 | 2456000000 |
| Sunday, January 1, 2017 | 1125200000 | 2611000000 |
| Monday, January 1, 2018 | 1111200000 | 2689000000 |
| Tuesday, January 1, 2019 | 1079800000 | 2371000000 |
| Wednesday, January 1, 2020 | 1040100000 | 2587000000 |
| Friday, January 1, 2021 | 1188400000 | 2863000000 |
| Saturday, January 1, 2022 | 1284700000 | 2713000000 |
| Sunday, January 1, 2023 | 1547800000 | 2836000000 |
| Monday, January 1, 2024 | 1771900000 | 2831000000 |
Unlocking the unknown
In the competitive landscape of the HVAC and home improvement industries, Lennox International Inc. and Masco Corporation have showcased intriguing gross profit trends over the past decade. From 2014 to 2023, Lennox International Inc. has seen a remarkable growth of approximately 96%, starting from a gross profit of $903 million in 2014 to an impressive $1.55 billion in 2023. This growth highlights Lennox's strategic advancements and market adaptability.
On the other hand, Masco Corporation, a leader in home improvement products, has maintained a steady upward trajectory, with its gross profit peaking at $2.86 billion in 2021, marking a 27% increase from 2014. However, data for 2024 is missing, leaving room for speculation on Masco's future performance.
These trends underscore the dynamic nature of these industries and the resilience of these companies in navigating economic challenges and market demands.
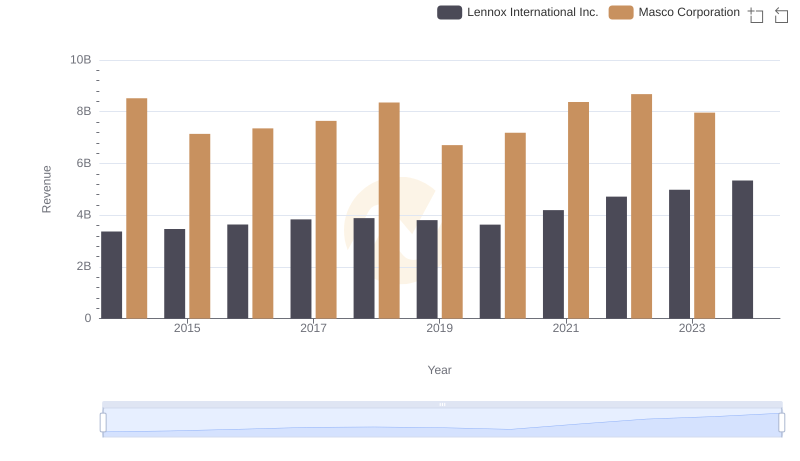
Lennox International Inc. vs Masco Corporation: Annual Revenue Growth Compared
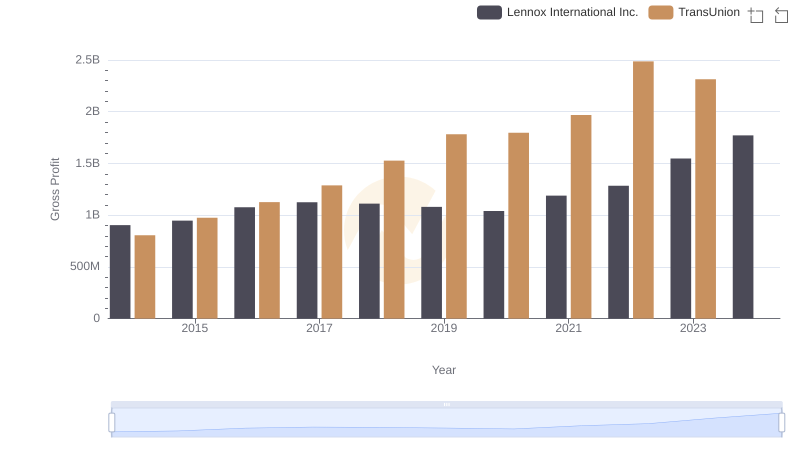
Gross Profit Trends Compared: Lennox International Inc. vs TransUnion
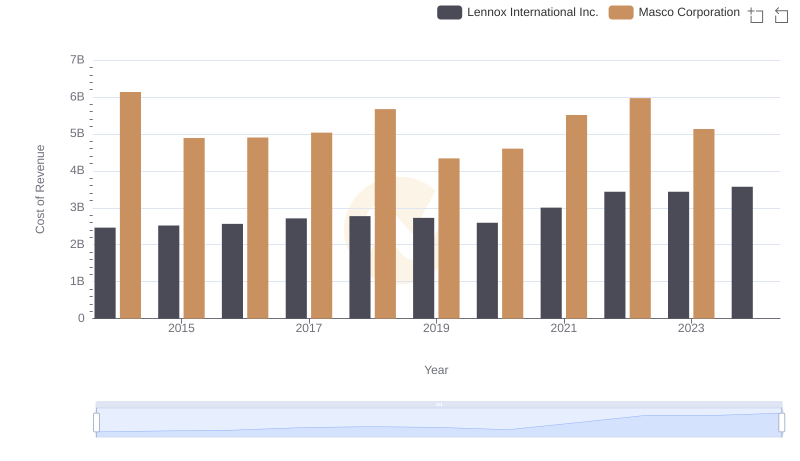
Analyzing Cost of Revenue: Lennox International Inc. and Masco Corporation
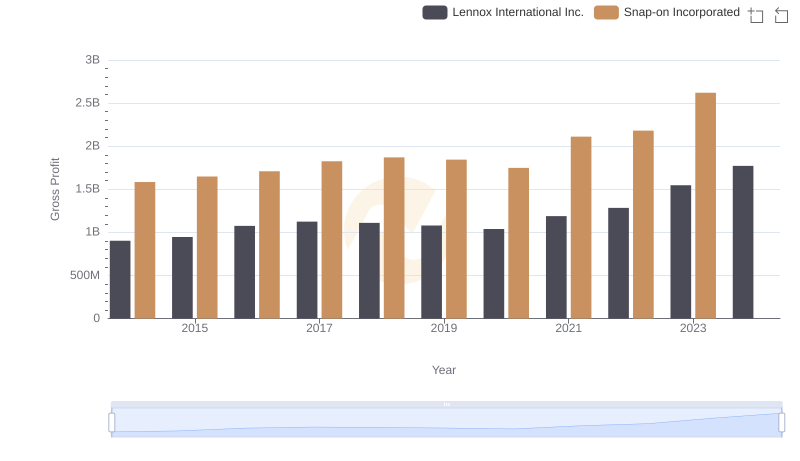
Lennox International Inc. vs Snap-on Incorporated: A Gross Profit Performance Breakdown
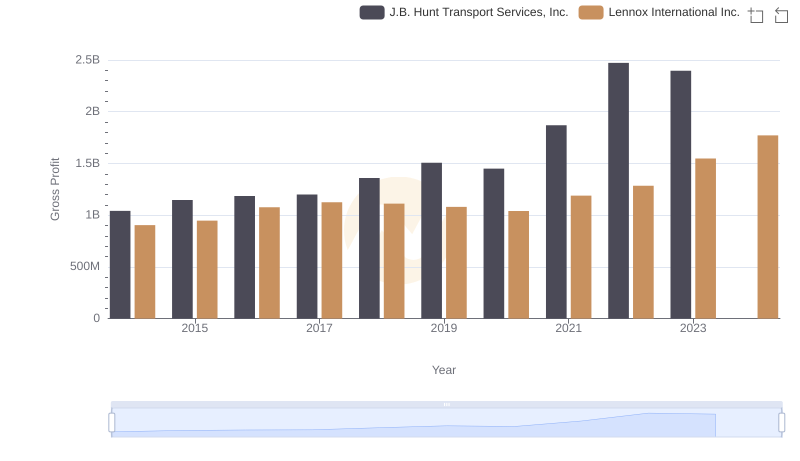
Lennox International Inc. and J.B. Hunt Transport Services, Inc.: A Detailed Gross Profit Analysis
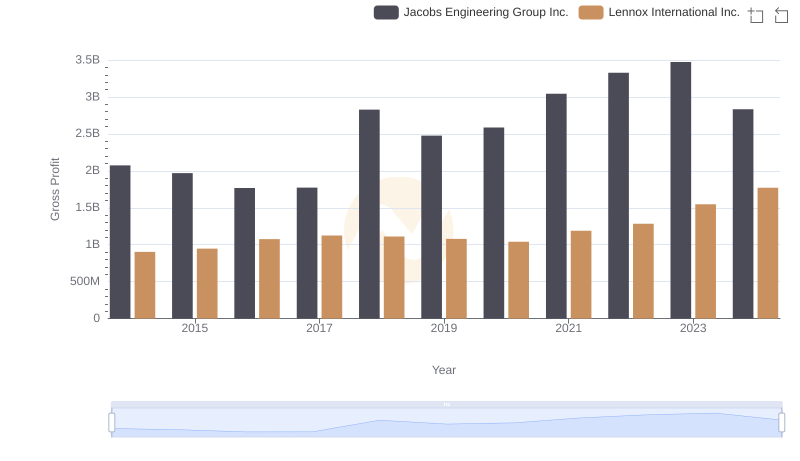
Who Generates Higher Gross Profit? Lennox International Inc. or Jacobs Engineering Group Inc.
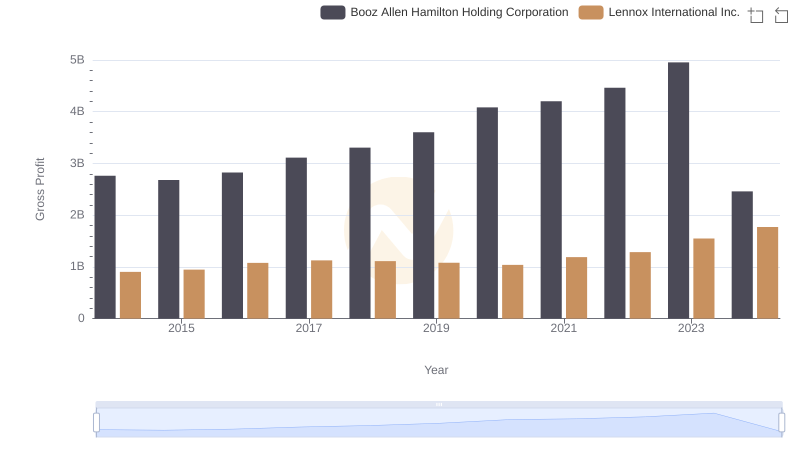
Gross Profit Trends Compared: Lennox International Inc. vs Booz Allen Hamilton Holding Corporation
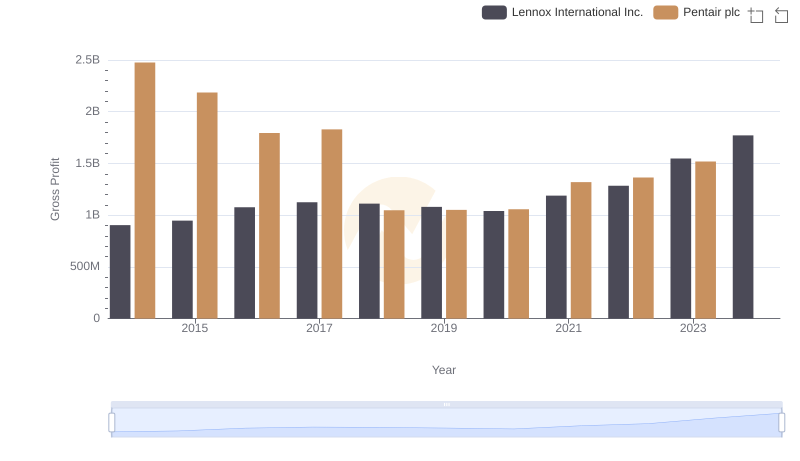
Gross Profit Analysis: Comparing Lennox International Inc. and Pentair plc
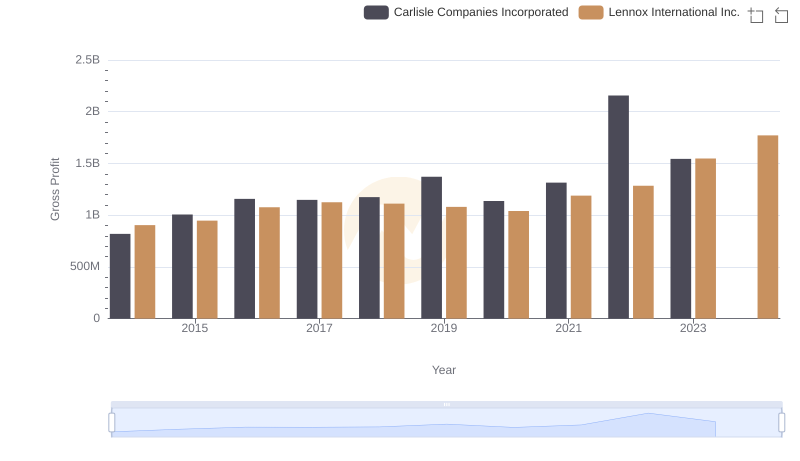
Gross Profit Trends Compared: Lennox International Inc. vs Carlisle Companies Incorporated
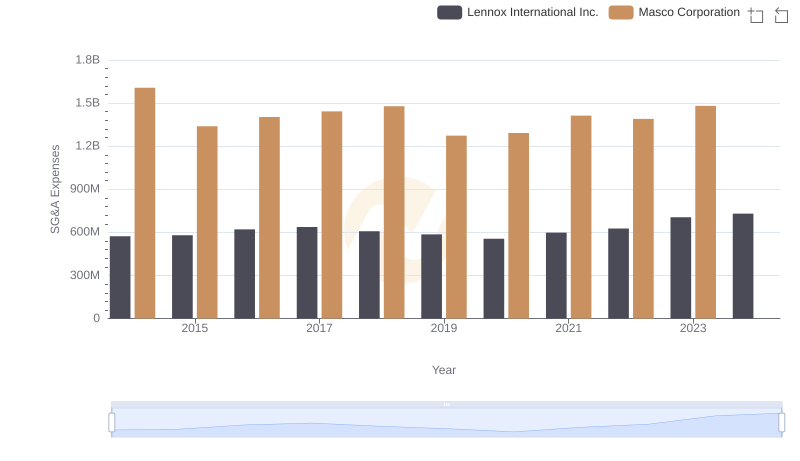
Lennox International Inc. or Masco Corporation: Who Manages SG&A Costs Better?
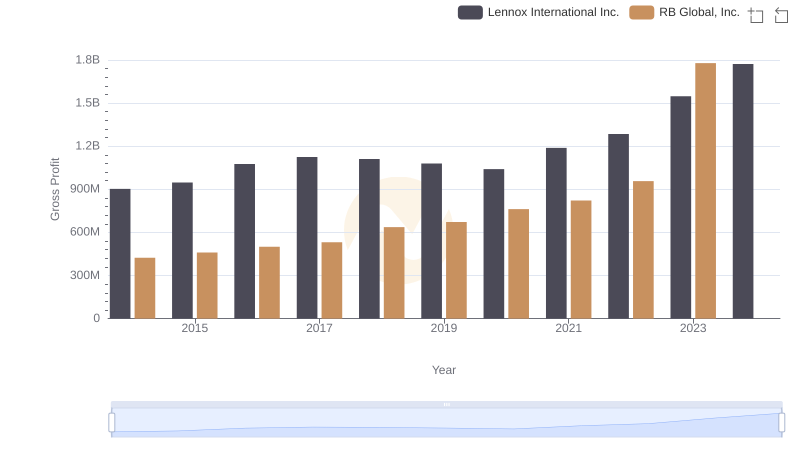
Lennox International Inc. vs RB Global, Inc.: A Gross Profit Performance Breakdown
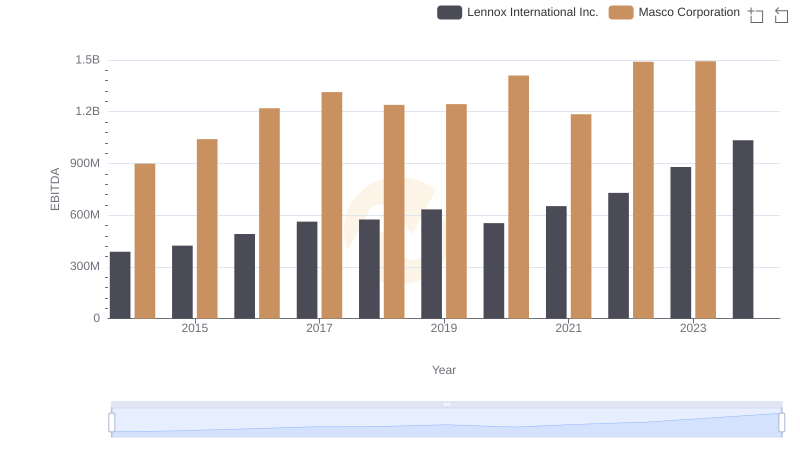
Comprehensive EBITDA Comparison: Lennox International Inc. vs Masco Corporation