| __timestamp | EMCOR Group, Inc. | Lennox International Inc. |
|---|---|---|
| Wednesday, January 1, 2014 | 907246000 | 903300000 |
| Thursday, January 1, 2015 | 944479000 | 947400000 |
| Friday, January 1, 2016 | 1037862000 | 1076500000 |
| Sunday, January 1, 2017 | 1147012000 | 1125200000 |
| Monday, January 1, 2018 | 1205453000 | 1111200000 |
| Tuesday, January 1, 2019 | 1355868000 | 1079800000 |
| Wednesday, January 1, 2020 | 1395382000 | 1040100000 |
| Friday, January 1, 2021 | 1501737000 | 1188400000 |
| Saturday, January 1, 2022 | 1603594000 | 1284700000 |
| Sunday, January 1, 2023 | 2089339000 | 1547800000 |
| Monday, January 1, 2024 | 1771900000 |
Igniting the spark of knowledge
In the competitive landscape of industrial services and climate control solutions, EMCOR Group, Inc. and Lennox International Inc. have shown remarkable growth in gross profit over the past decade. From 2014 to 2023, EMCOR's gross profit surged by approximately 130%, peaking in 2023. Lennox, not far behind, experienced a 71% increase during the same period, with a notable jump in 2024. This upward trajectory highlights the resilience and strategic prowess of both companies in navigating market challenges. While EMCOR consistently outperformed Lennox, the latter's recent gains suggest a promising future. The data for 2024, however, is incomplete for EMCOR, leaving room for speculation on its continued growth. As these industry giants continue to innovate, stakeholders and investors should keep a keen eye on their financial health and market strategies.
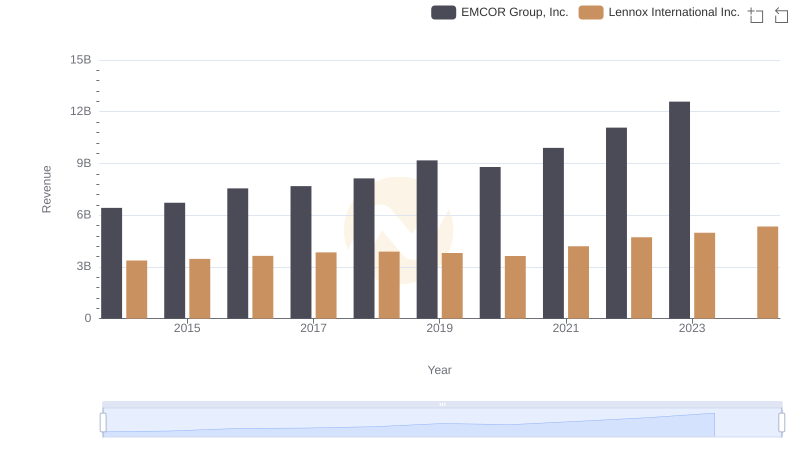
Who Generates More Revenue? Lennox International Inc. or EMCOR Group, Inc.
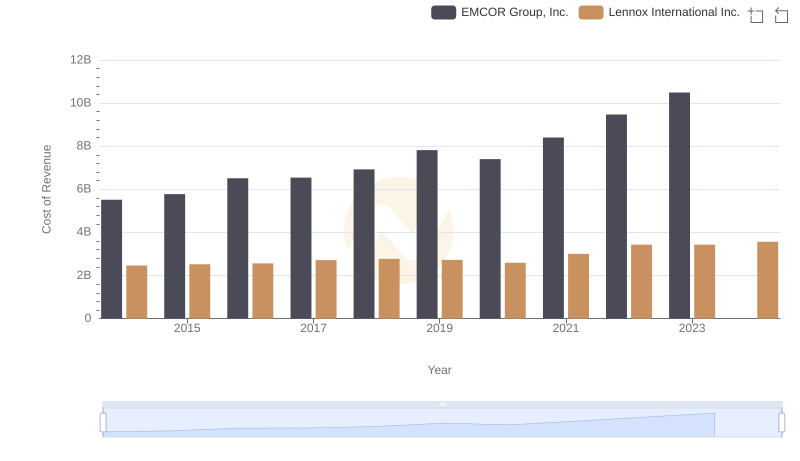
Comparing Cost of Revenue Efficiency: Lennox International Inc. vs EMCOR Group, Inc.
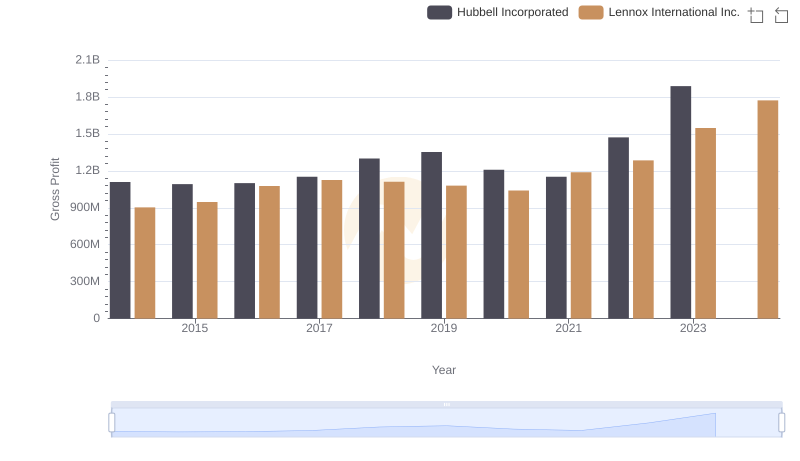
Key Insights on Gross Profit: Lennox International Inc. vs Hubbell Incorporated
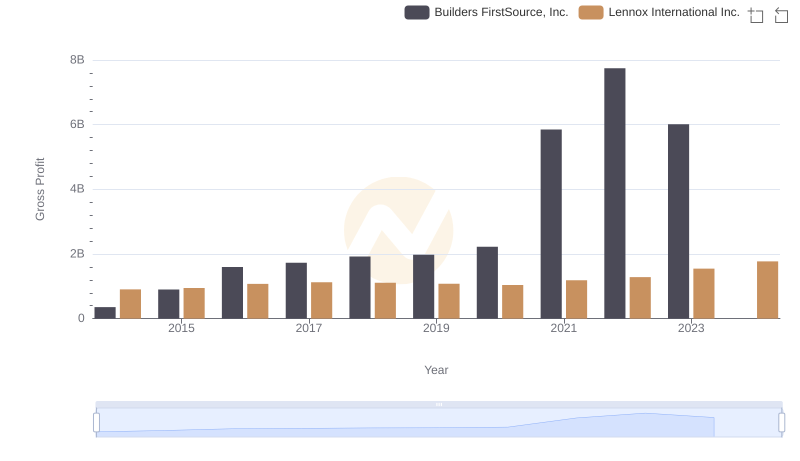
Gross Profit Trends Compared: Lennox International Inc. vs Builders FirstSource, Inc.
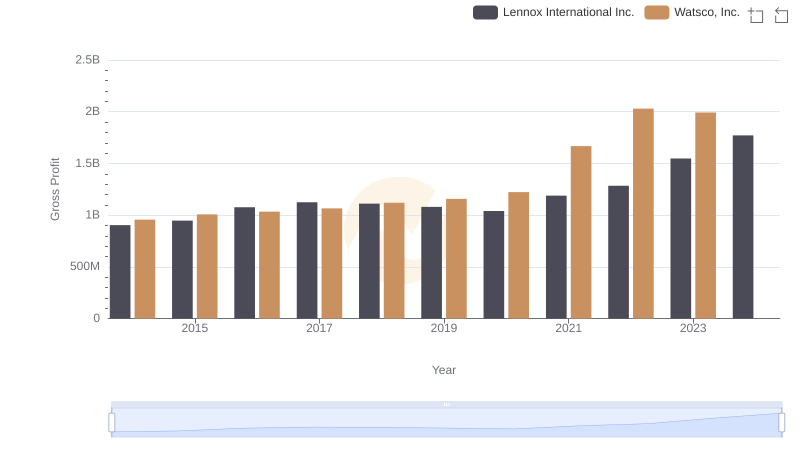
Lennox International Inc. and Watsco, Inc.: A Detailed Gross Profit Analysis
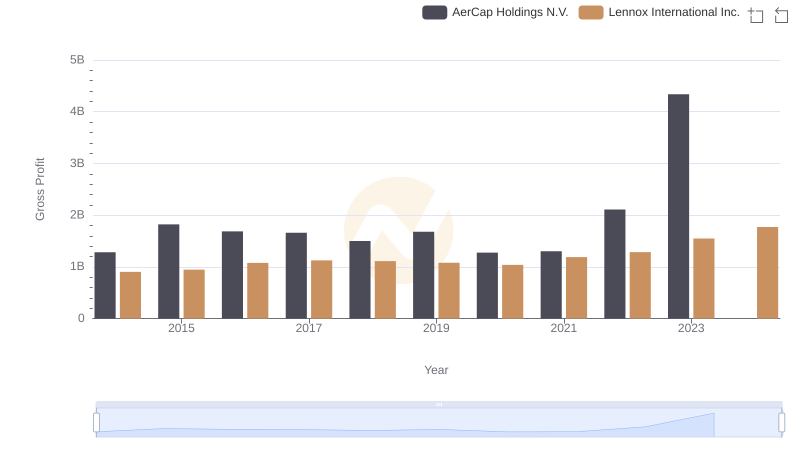
Gross Profit Trends Compared: Lennox International Inc. vs AerCap Holdings N.V.
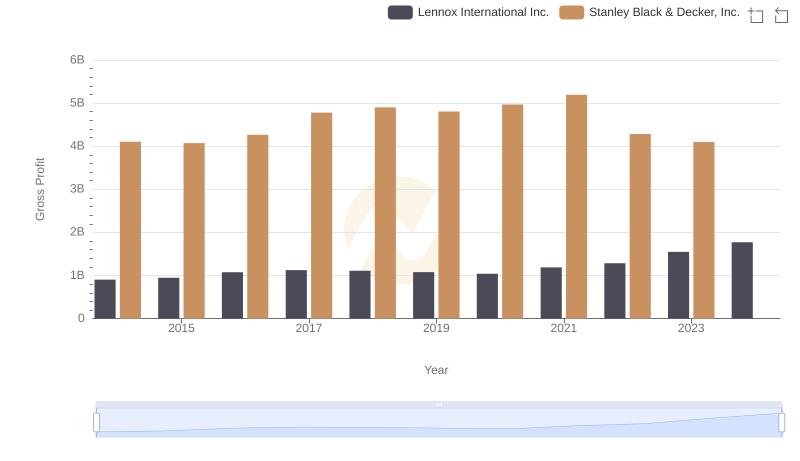
Key Insights on Gross Profit: Lennox International Inc. vs Stanley Black & Decker, Inc.
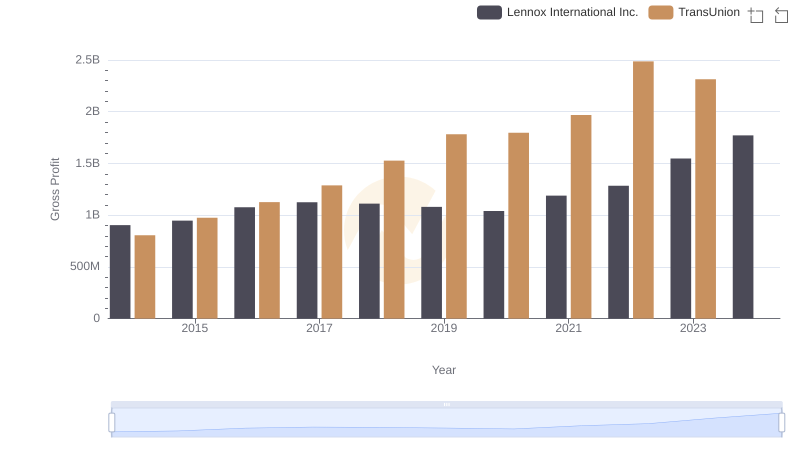
Gross Profit Trends Compared: Lennox International Inc. vs TransUnion
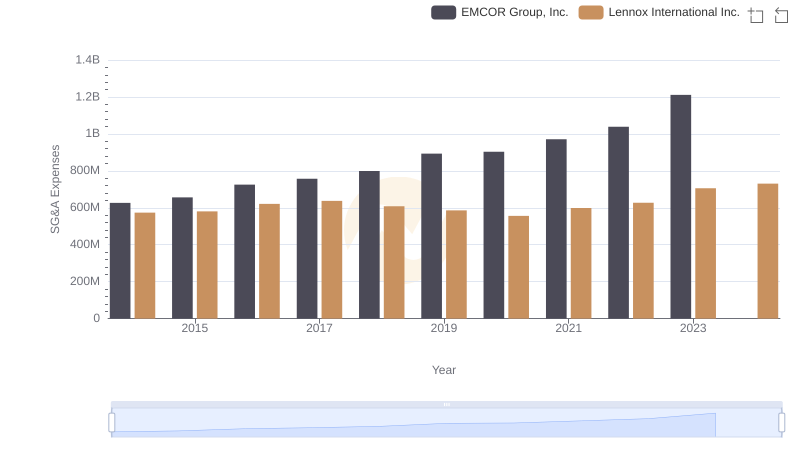
Who Optimizes SG&A Costs Better? Lennox International Inc. or EMCOR Group, Inc.
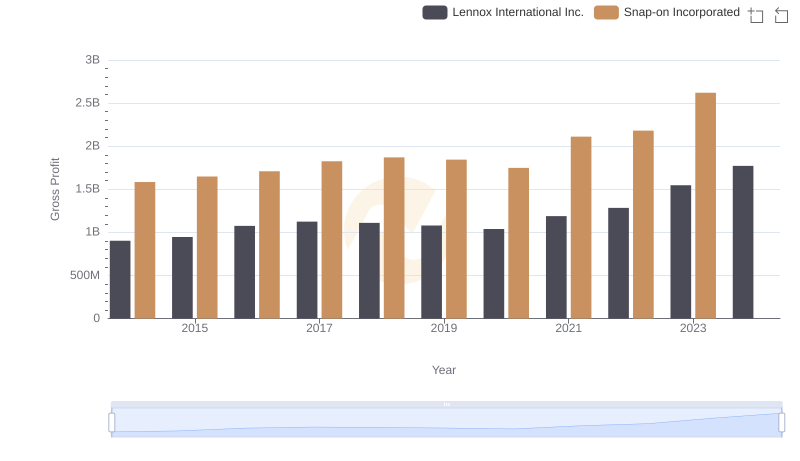
Lennox International Inc. vs Snap-on Incorporated: A Gross Profit Performance Breakdown
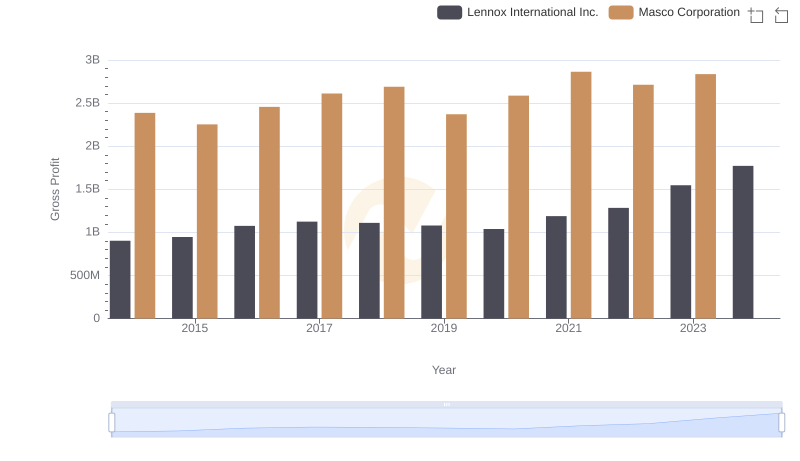
Gross Profit Trends Compared: Lennox International Inc. vs Masco Corporation
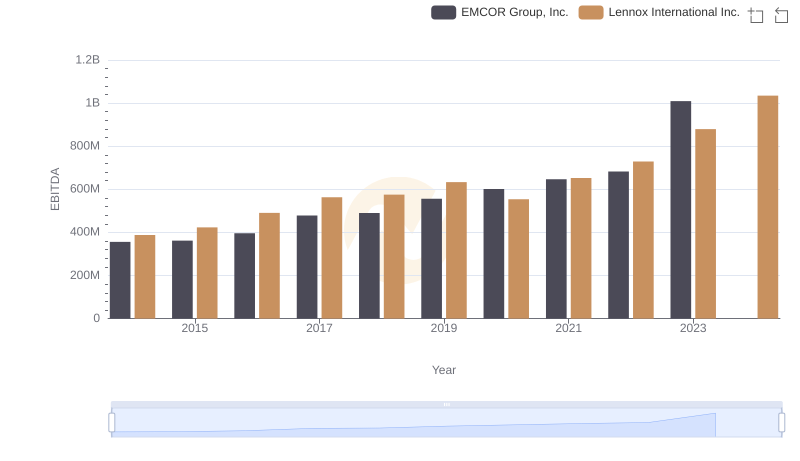
Lennox International Inc. vs EMCOR Group, Inc.: In-Depth EBITDA Performance Comparison