| __timestamp | AerCap Holdings N.V. | Lennox International Inc. |
|---|---|---|
| Wednesday, January 1, 2014 | 1282919000 | 903300000 |
| Thursday, January 1, 2015 | 1822255000 | 947400000 |
| Friday, January 1, 2016 | 1686404000 | 1076500000 |
| Sunday, January 1, 2017 | 1660054000 | 1125200000 |
| Monday, January 1, 2018 | 1500345000 | 1111200000 |
| Tuesday, January 1, 2019 | 1678249000 | 1079800000 |
| Wednesday, January 1, 2020 | 1276496000 | 1040100000 |
| Friday, January 1, 2021 | 1301517000 | 1188400000 |
| Saturday, January 1, 2022 | 2109708000 | 1284700000 |
| Sunday, January 1, 2023 | 4337648000 | 1547800000 |
| Monday, January 1, 2024 | 1771900000 |
In pursuit of knowledge
In the ever-evolving landscape of global business, Lennox International Inc. and AerCap Holdings N.V. stand as intriguing examples of financial resilience and growth. From 2014 to 2023, AerCap Holdings N.V. experienced a remarkable surge in gross profit, culminating in a staggering 238% increase by 2023. This growth trajectory highlights AerCap's strategic prowess in the aviation leasing industry. Meanwhile, Lennox International Inc., a leader in climate control solutions, demonstrated steady growth with a 71% rise in gross profit over the same period. Notably, Lennox's gross profit peaked in 2024, showcasing its robust market position. The data reveals a fascinating narrative of two companies navigating their respective industries with distinct strategies. While AerCap's growth was meteoric, Lennox's consistent performance underscores its stability. Missing data for AerCap in 2024 suggests potential challenges or strategic shifts, adding another layer of intrigue to this financial tale.
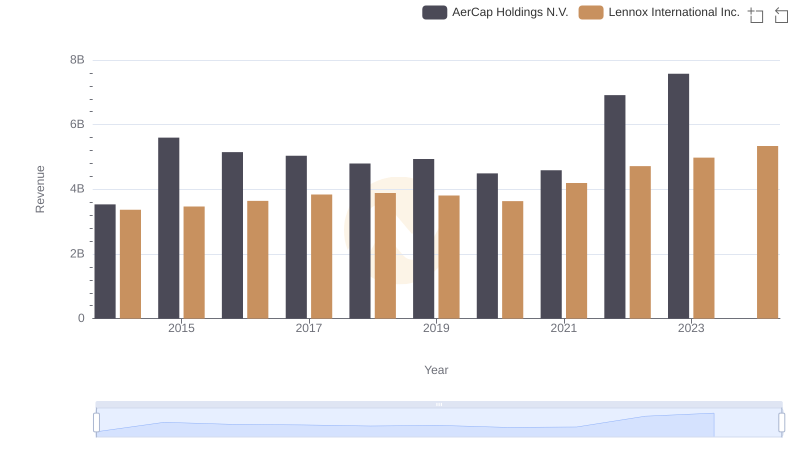
Annual Revenue Comparison: Lennox International Inc. vs AerCap Holdings N.V.
Analyzing Cost of Revenue: Lennox International Inc. and AerCap Holdings N.V.
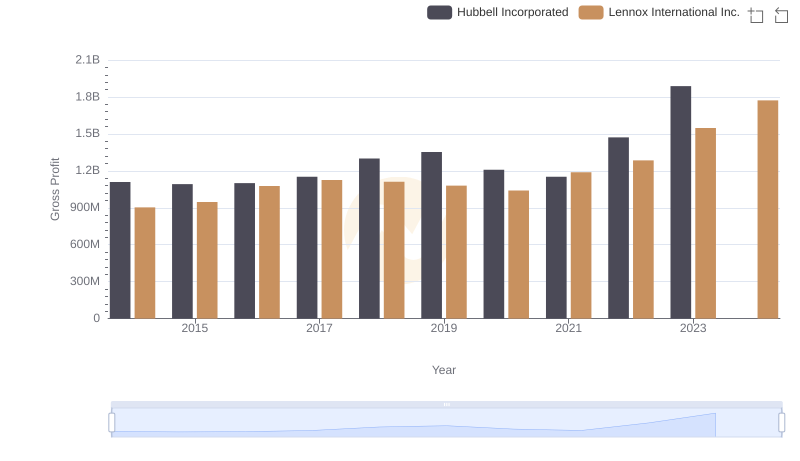
Key Insights on Gross Profit: Lennox International Inc. vs Hubbell Incorporated
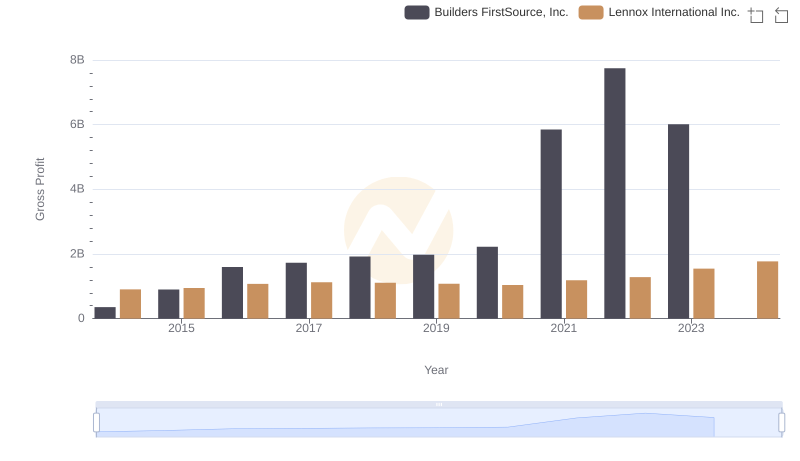
Gross Profit Trends Compared: Lennox International Inc. vs Builders FirstSource, Inc.
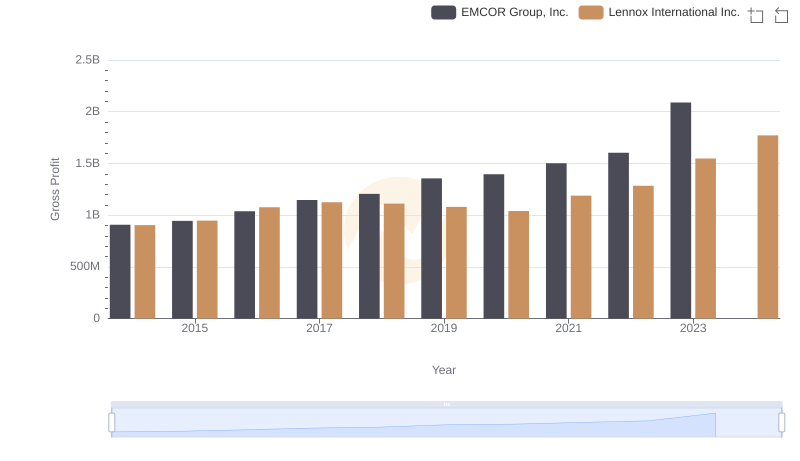
Gross Profit Trends Compared: Lennox International Inc. vs EMCOR Group, Inc.
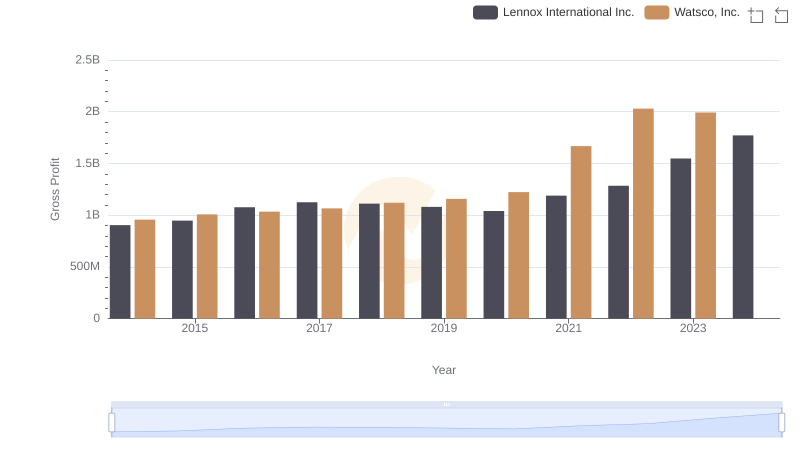
Lennox International Inc. and Watsco, Inc.: A Detailed Gross Profit Analysis
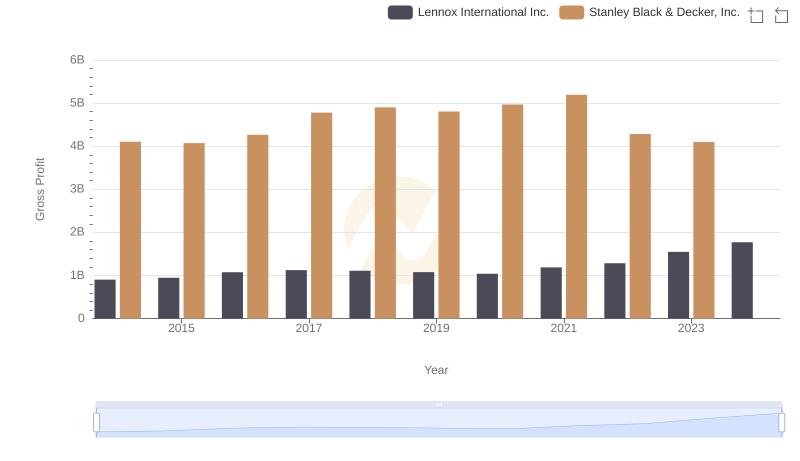
Key Insights on Gross Profit: Lennox International Inc. vs Stanley Black & Decker, Inc.
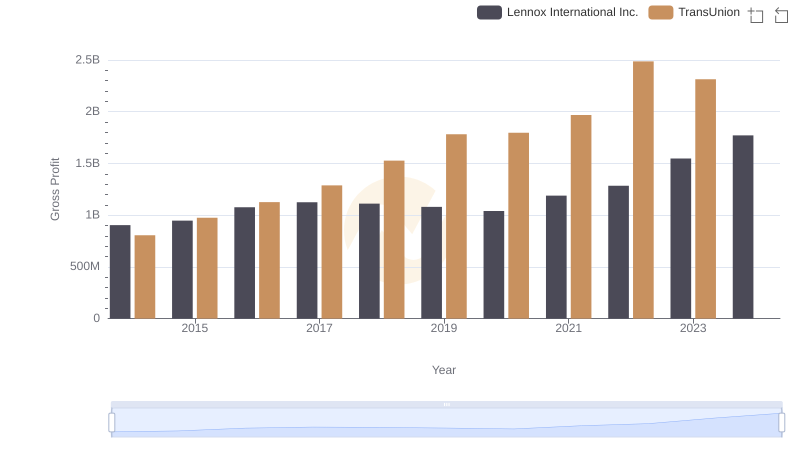
Gross Profit Trends Compared: Lennox International Inc. vs TransUnion
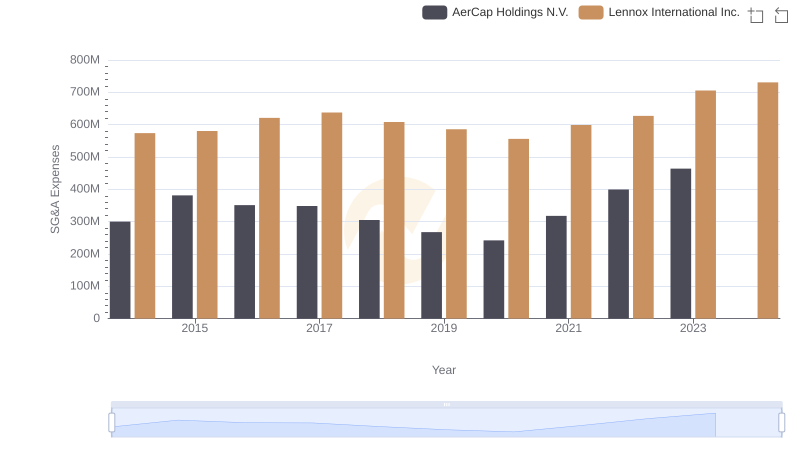
Operational Costs Compared: SG&A Analysis of Lennox International Inc. and AerCap Holdings N.V.
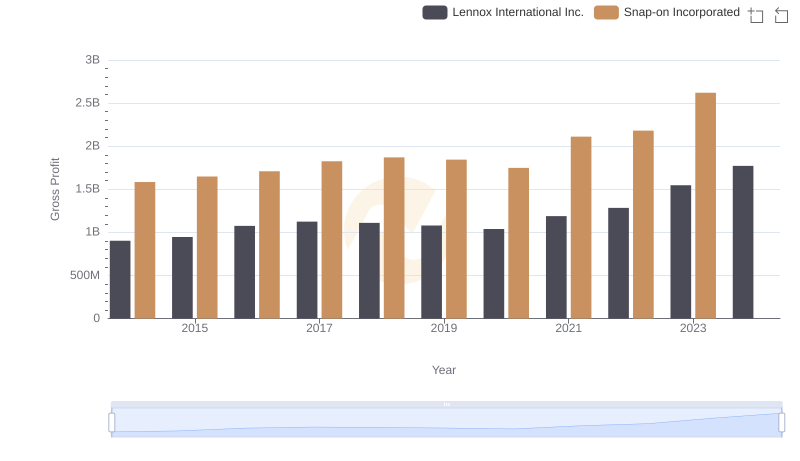
Lennox International Inc. vs Snap-on Incorporated: A Gross Profit Performance Breakdown
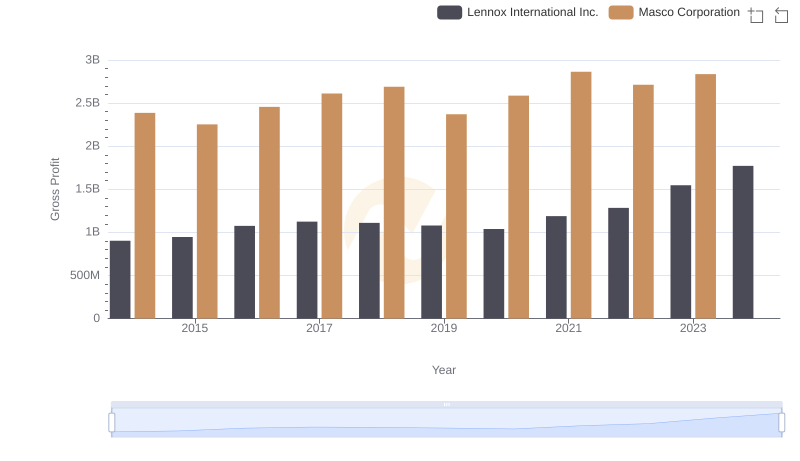
Gross Profit Trends Compared: Lennox International Inc. vs Masco Corporation
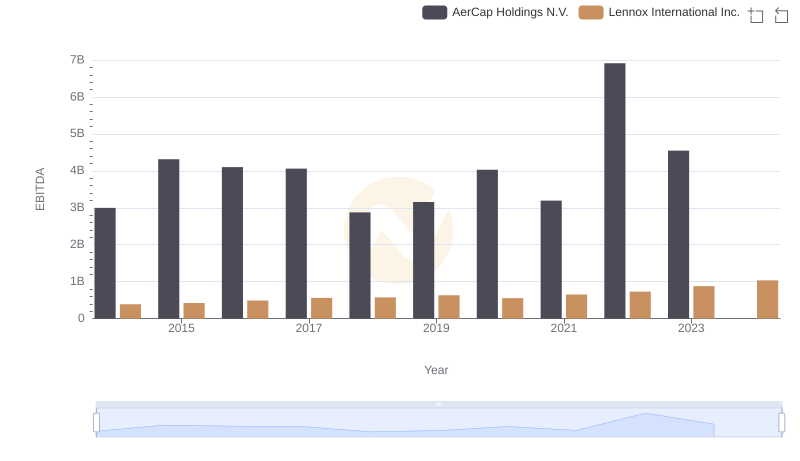
EBITDA Analysis: Evaluating Lennox International Inc. Against AerCap Holdings N.V.