| __timestamp | Intuit Inc. | The Trade Desk, Inc. |
|---|---|---|
| Wednesday, January 1, 2014 | 668000000 | 12559000 |
| Thursday, January 1, 2015 | 725000000 | 22967000 |
| Friday, January 1, 2016 | 752000000 | 39876000 |
| Sunday, January 1, 2017 | 809000000 | 66230000 |
| Monday, January 1, 2018 | 977000000 | 114098000 |
| Tuesday, January 1, 2019 | 1167000000 | 156180000 |
| Wednesday, January 1, 2020 | 1378000000 | 178812000 |
| Friday, January 1, 2021 | 1683000000 | 221554000 |
| Saturday, January 1, 2022 | 2406000000 | 281123000 |
| Sunday, January 1, 2023 | 3143000000 | 365598000 |
| Monday, January 1, 2024 | 3465000000 | 472012000 |
Unleashing the power of data
In the ever-evolving landscape of technology and advertising, Intuit Inc. and The Trade Desk, Inc. have emerged as key players. Over the past decade, Intuit's cost of revenue has surged by over 400%, reflecting its expanding operations and market reach. In contrast, The Trade Desk, Inc. has seen a remarkable increase of nearly 2800% in its cost of revenue, showcasing its rapid growth in the digital advertising space.
From 2014 to 2023, Intuit's cost efficiency has been relatively stable, with a consistent upward trend, peaking in 2023. Meanwhile, The Trade Desk, Inc. has experienced a more volatile trajectory, with significant growth year-on-year, highlighting its aggressive expansion strategy. Notably, data for 2024 is incomplete, indicating potential shifts in the coming year. This analysis underscores the dynamic nature of cost management in tech and advertising sectors, offering valuable insights for investors and industry enthusiasts.
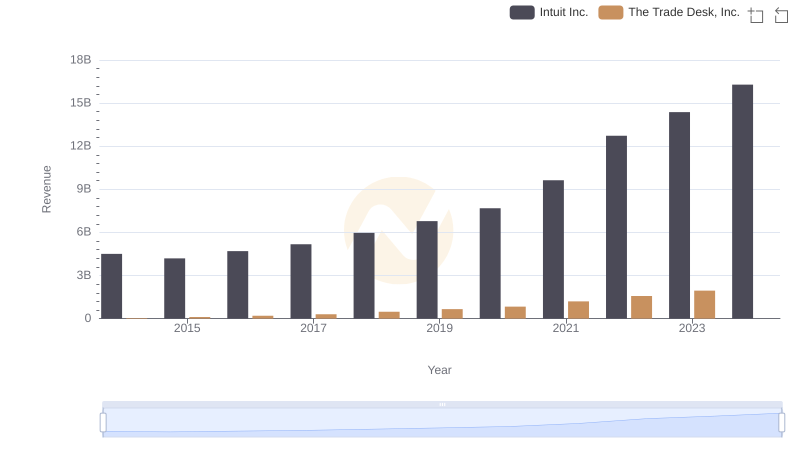
Revenue Insights: Intuit Inc. and The Trade Desk, Inc. Performance Compared
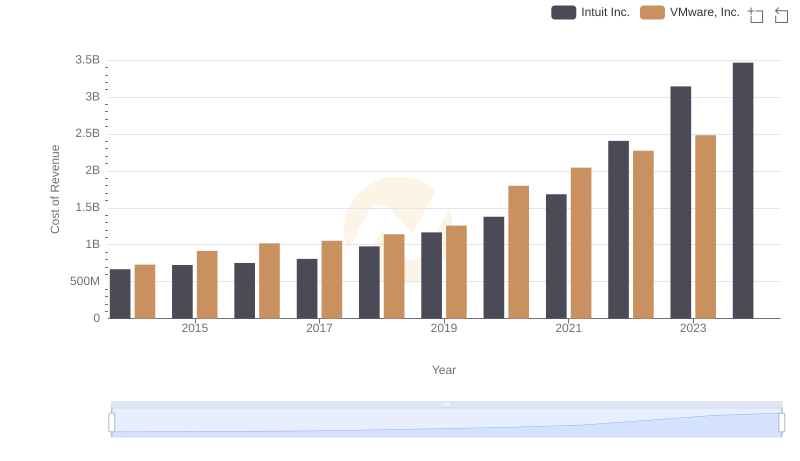
Analyzing Cost of Revenue: Intuit Inc. and VMware, Inc.
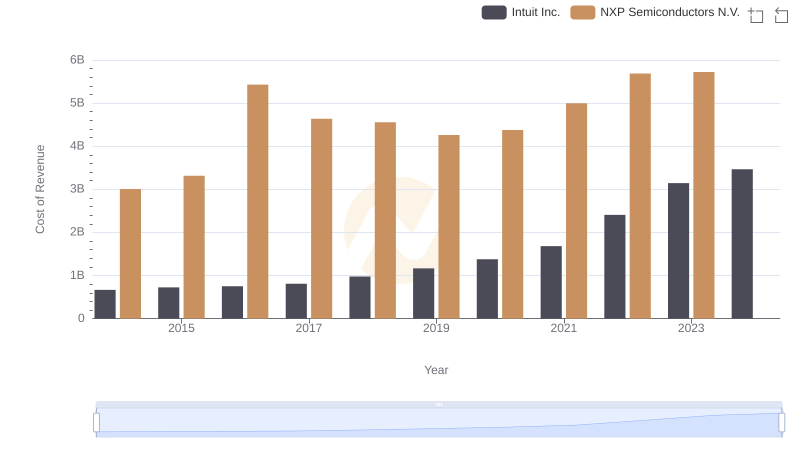
Comparing Cost of Revenue Efficiency: Intuit Inc. vs NXP Semiconductors N.V.
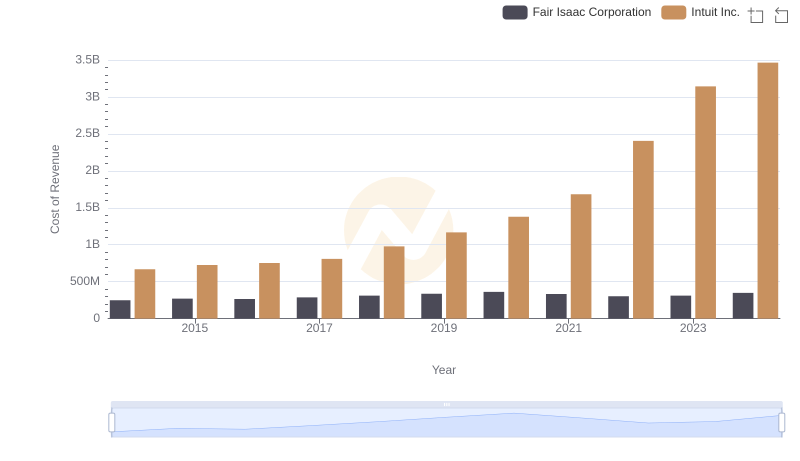
Cost of Revenue Comparison: Intuit Inc. vs Fair Isaac Corporation
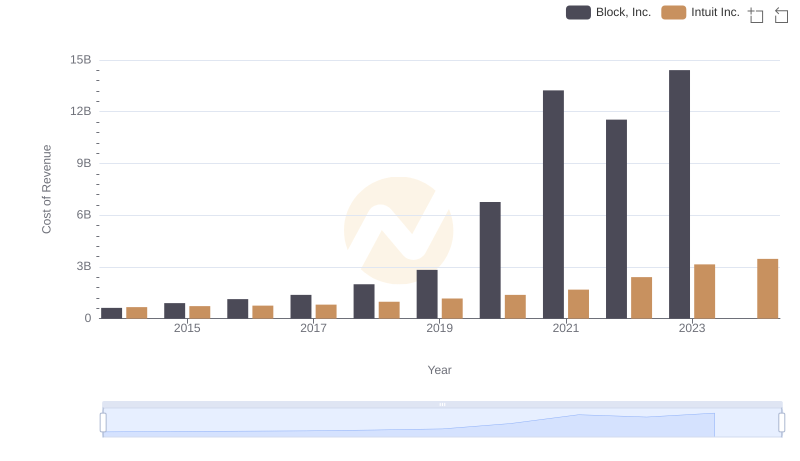
Cost Insights: Breaking Down Intuit Inc. and Block, Inc.'s Expenses
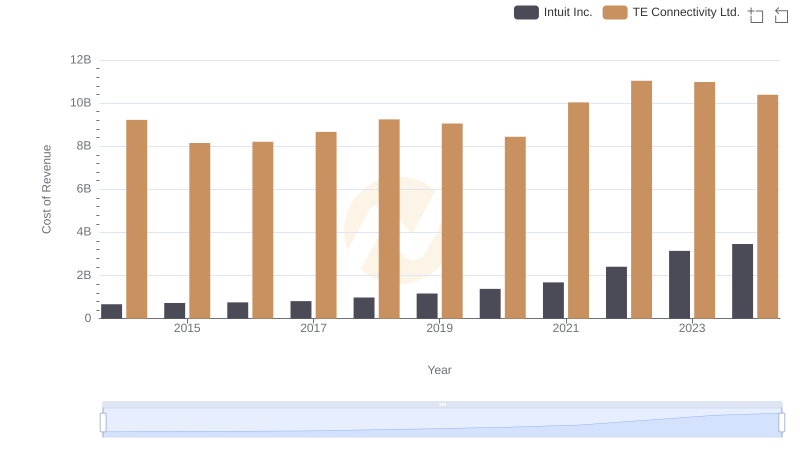
Cost of Revenue: Key Insights for Intuit Inc. and TE Connectivity Ltd.
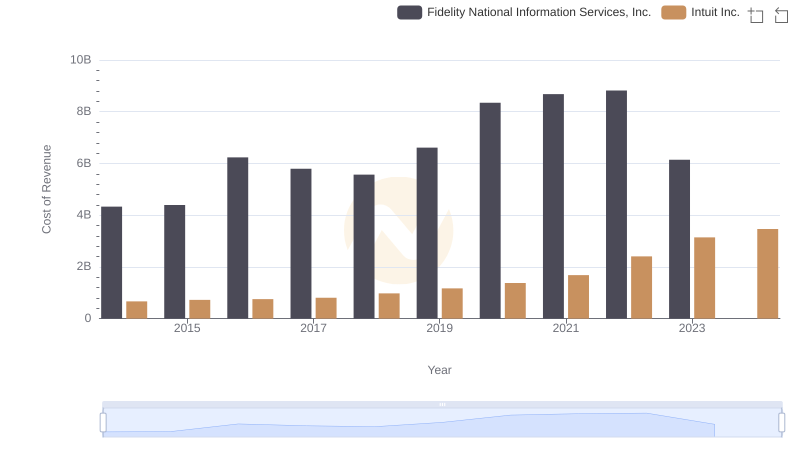
Intuit Inc. vs Fidelity National Information Services, Inc.: Efficiency in Cost of Revenue Explored
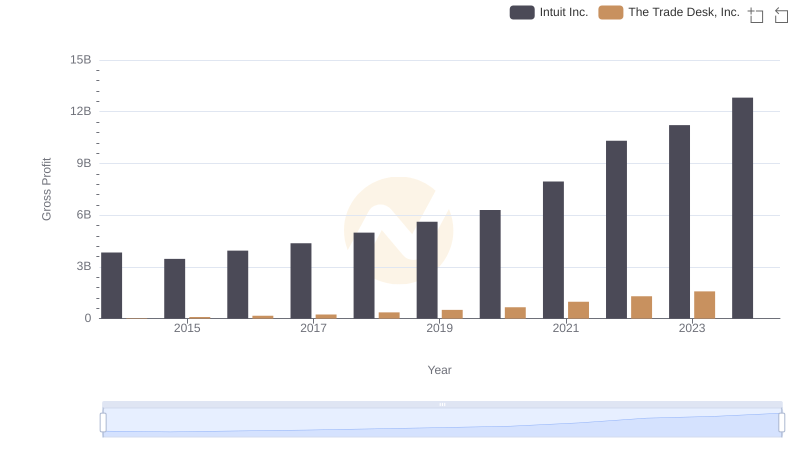
Gross Profit Comparison: Intuit Inc. and The Trade Desk, Inc. Trends
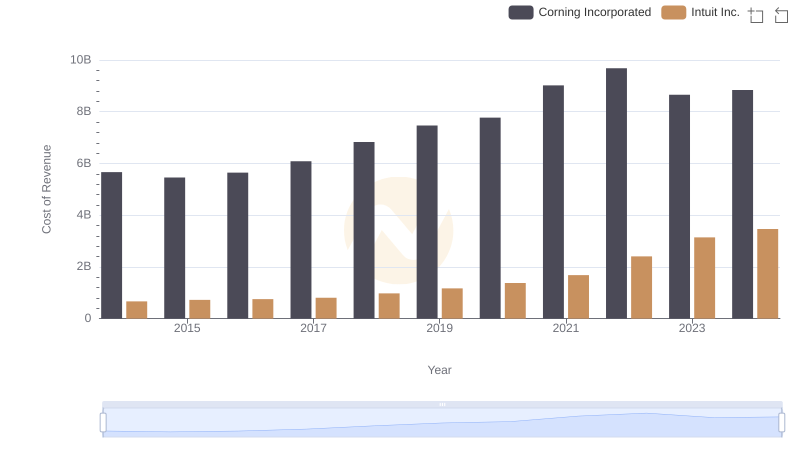
Cost of Revenue Trends: Intuit Inc. vs Corning Incorporated
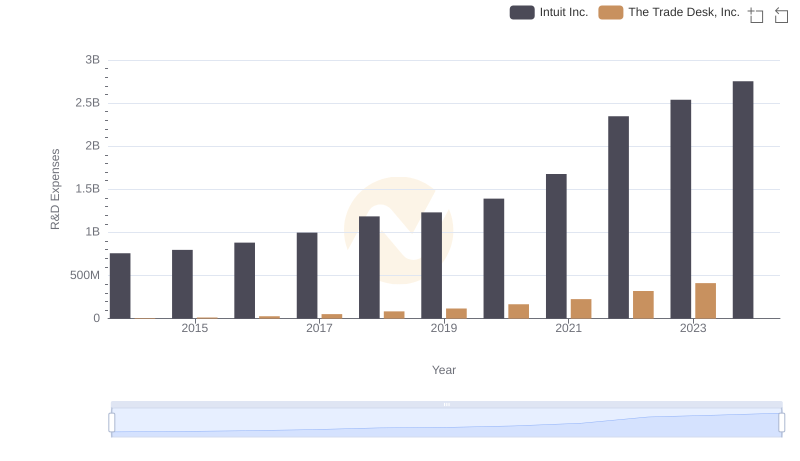
Research and Development Expenses Breakdown: Intuit Inc. vs The Trade Desk, Inc.
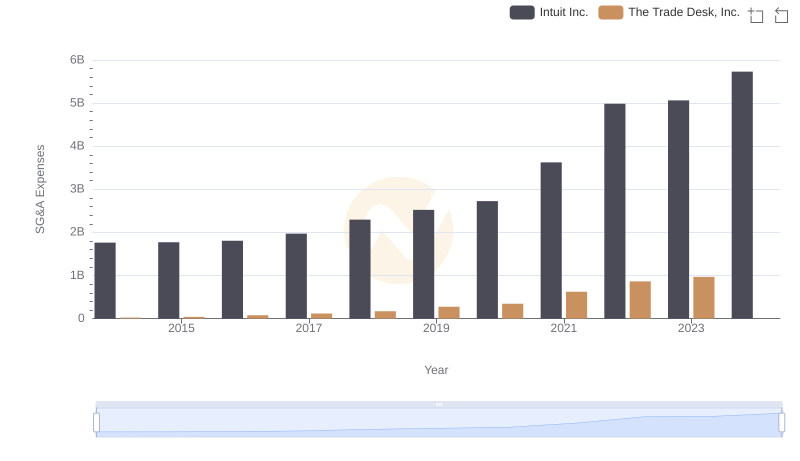
Intuit Inc. vs The Trade Desk, Inc.: SG&A Expense Trends
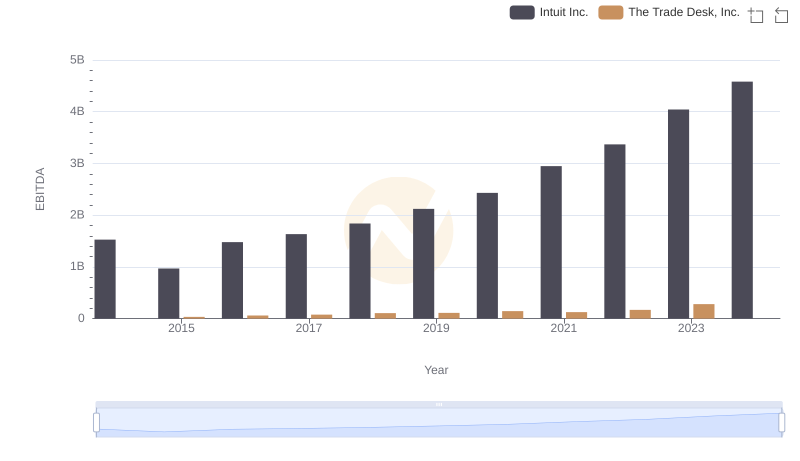
EBITDA Metrics Evaluated: Intuit Inc. vs The Trade Desk, Inc.