| __timestamp | Intuit Inc. | The Trade Desk, Inc. |
|---|---|---|
| Wednesday, January 1, 2014 | 758000000 | 7250000 |
| Thursday, January 1, 2015 | 798000000 | 12819000 |
| Friday, January 1, 2016 | 881000000 | 27313000 |
| Sunday, January 1, 2017 | 998000000 | 52806000 |
| Monday, January 1, 2018 | 1186000000 | 83892000 |
| Tuesday, January 1, 2019 | 1233000000 | 116752000 |
| Wednesday, January 1, 2020 | 1392000000 | 166654000 |
| Friday, January 1, 2021 | 1678000000 | 226137000 |
| Saturday, January 1, 2022 | 2347000000 | 319876000 |
| Sunday, January 1, 2023 | 2539000000 | 411794000 |
| Monday, January 1, 2024 | 2754000000 | 463319000 |
Infusing magic into the data realm
In the ever-evolving landscape of technology, research and development (R&D) expenses serve as a barometer of innovation and future growth. Over the past decade, Intuit Inc. and The Trade Desk, Inc. have demonstrated contrasting yet fascinating trajectories in their R&D investments.
From 2014 to 2023, Intuit Inc. has consistently increased its R&D spending, growing by approximately 263%, reflecting its commitment to maintaining a competitive edge in financial software. In contrast, The Trade Desk, Inc., a leader in digital advertising, has shown a staggering 5,580% increase in R&D expenses, albeit from a smaller base, highlighting its aggressive push into new technologies.
While Intuit's R&D expenses reached their peak in 2023, The Trade Desk's data for 2024 remains elusive, leaving room for speculation on its future strategies. This comparison underscores the diverse approaches companies take in navigating the tech industry's dynamic landscape.
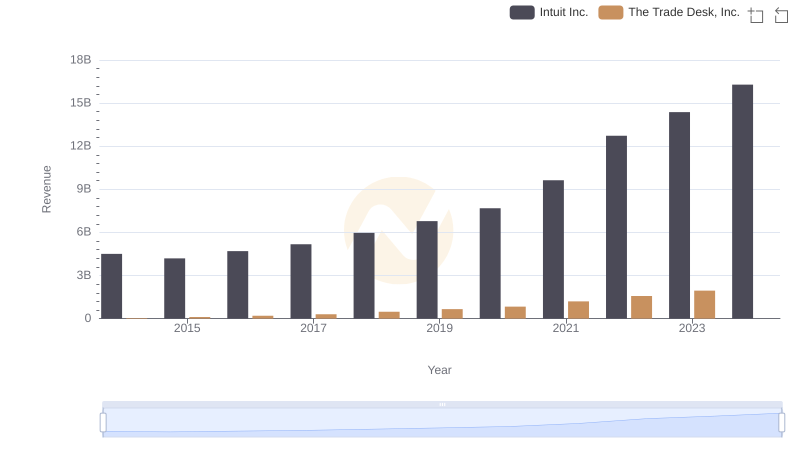
Revenue Insights: Intuit Inc. and The Trade Desk, Inc. Performance Compared
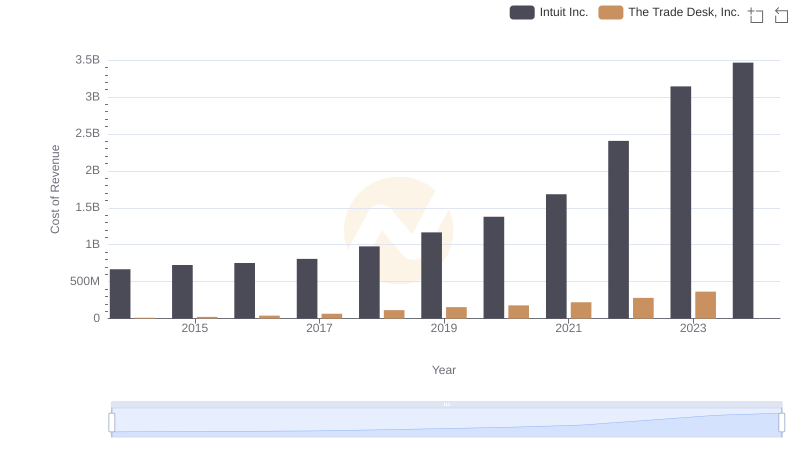
Intuit Inc. vs The Trade Desk, Inc.: Efficiency in Cost of Revenue Explored
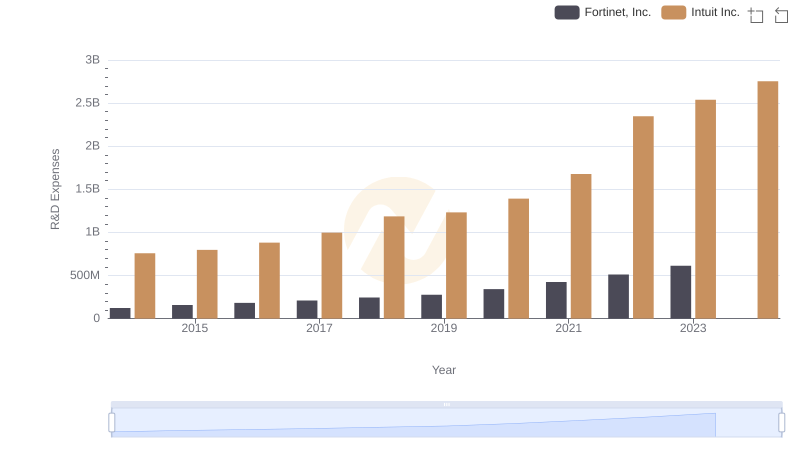
Intuit Inc. vs Fortinet, Inc.: Strategic Focus on R&D Spending
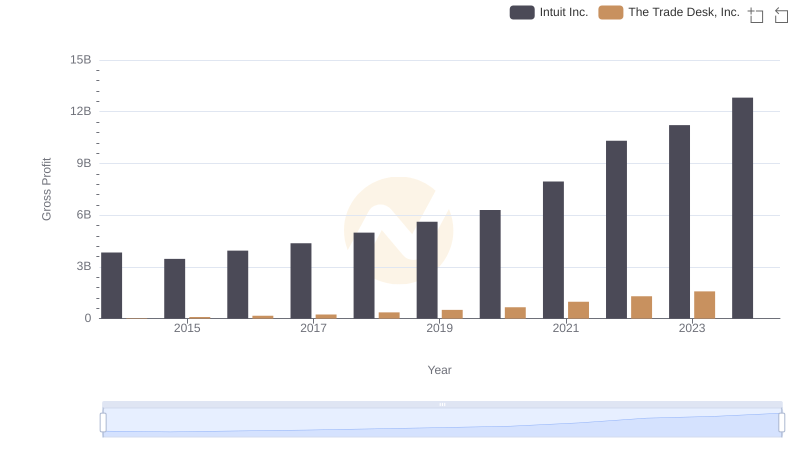
Gross Profit Comparison: Intuit Inc. and The Trade Desk, Inc. Trends
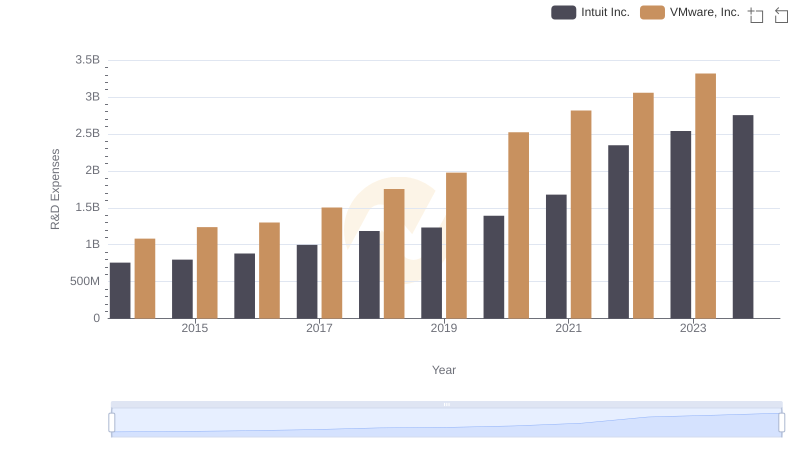
Intuit Inc. or VMware, Inc.: Who Invests More in Innovation?
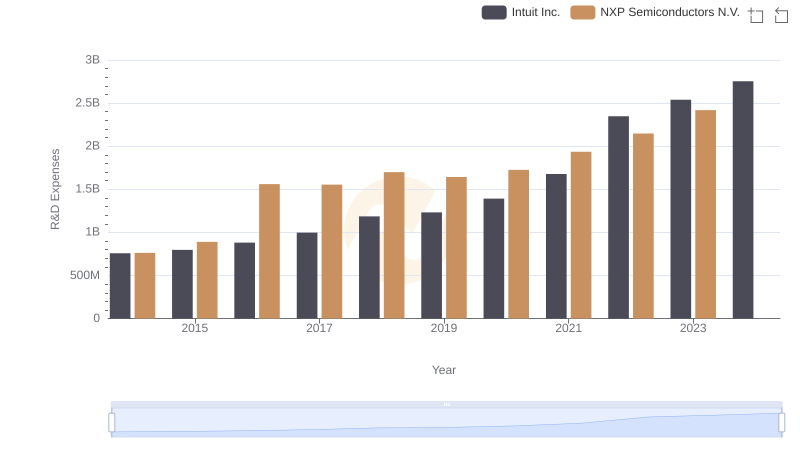
Who Prioritizes Innovation? R&D Spending Compared for Intuit Inc. and NXP Semiconductors N.V.
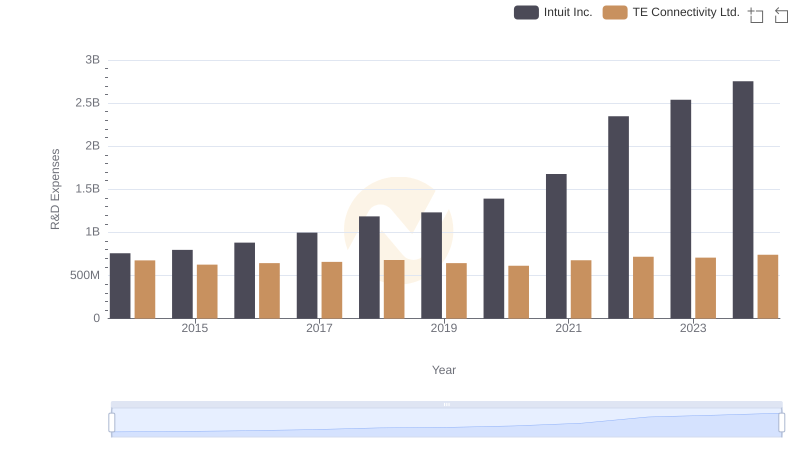
Intuit Inc. or TE Connectivity Ltd.: Who Invests More in Innovation?
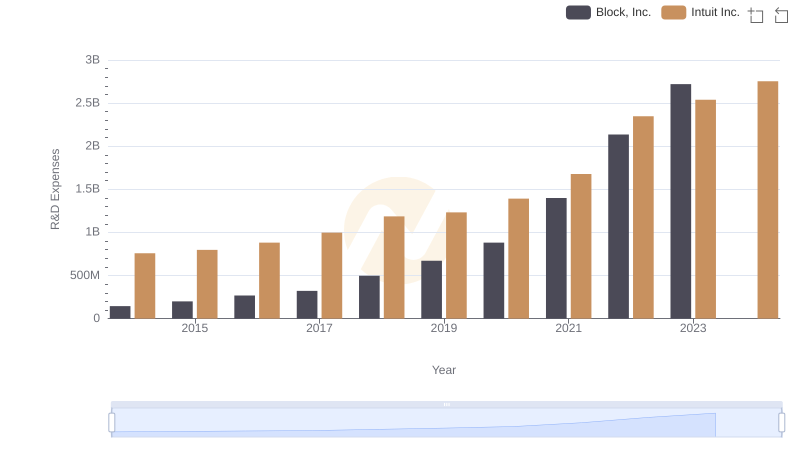
Comparing Innovation Spending: Intuit Inc. and Block, Inc.
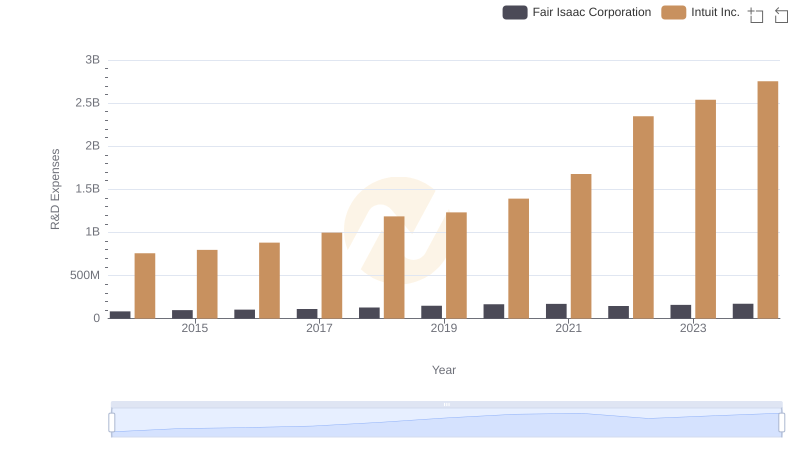
R&D Spending Showdown: Intuit Inc. vs Fair Isaac Corporation
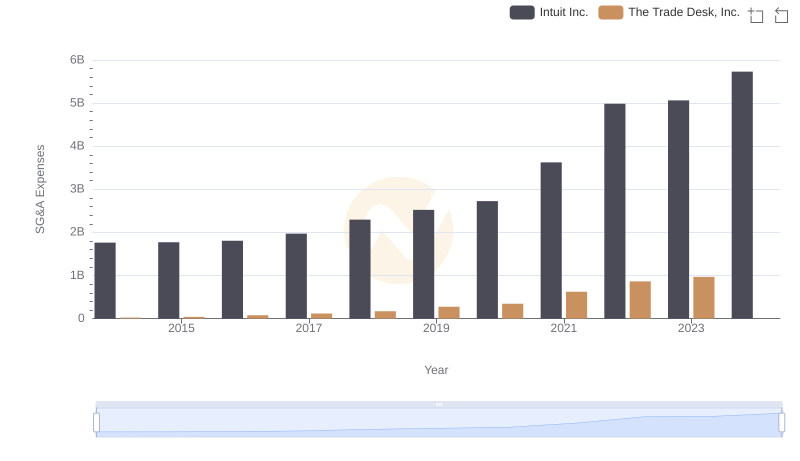
Intuit Inc. vs The Trade Desk, Inc.: SG&A Expense Trends
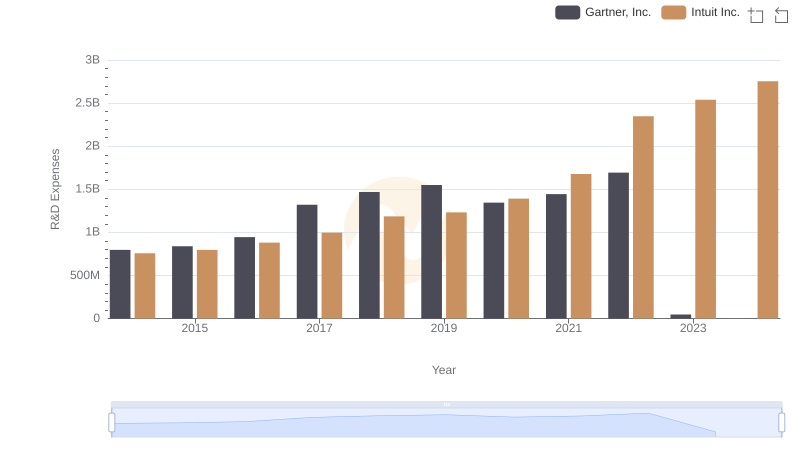
Intuit Inc. vs Gartner, Inc.: Strategic Focus on R&D Spending
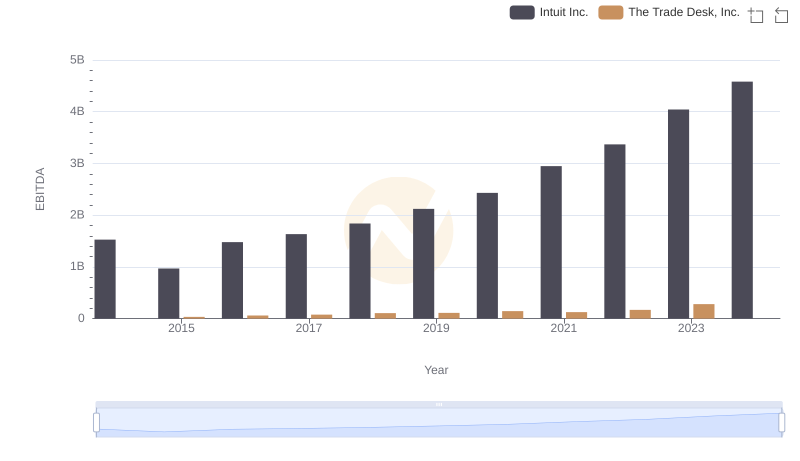
EBITDA Metrics Evaluated: Intuit Inc. vs The Trade Desk, Inc.