| __timestamp | Block, Inc. | Intuit Inc. |
|---|---|---|
| Wednesday, January 1, 2014 | 624118000 | 668000000 |
| Thursday, January 1, 2015 | 897088000 | 725000000 |
| Friday, January 1, 2016 | 1132683000 | 752000000 |
| Sunday, January 1, 2017 | 1374947000 | 809000000 |
| Monday, January 1, 2018 | 1994477000 | 977000000 |
| Tuesday, January 1, 2019 | 2823815000 | 1167000000 |
| Wednesday, January 1, 2020 | 6764169000 | 1378000000 |
| Friday, January 1, 2021 | 13241380000 | 1683000000 |
| Saturday, January 1, 2022 | 11539695000 | 2406000000 |
| Sunday, January 1, 2023 | 14410737000 | 3143000000 |
| Monday, January 1, 2024 | 3465000000 |
Igniting the spark of knowledge
In the ever-evolving landscape of financial technology, understanding the cost dynamics of industry giants like Intuit Inc. and Block, Inc. (formerly Square) is crucial. Over the past decade, these companies have shown remarkable growth in their cost of revenue, reflecting their expanding operations and market influence.
From 2014 to 2023, Block, Inc. experienced a staggering increase in its cost of revenue, growing by over 2,200%. This surge highlights the company's aggressive expansion and investment in new technologies. In contrast, Intuit Inc. saw a more modest growth of approximately 370% during the same period, indicating a steady and strategic scaling of its operations.
Interestingly, the data for 2024 is incomplete, with Block, Inc.'s figures missing. This gap suggests potential shifts or strategic changes within the company. As these financial titans continue to evolve, their cost structures offer valuable insights into their future trajectories.
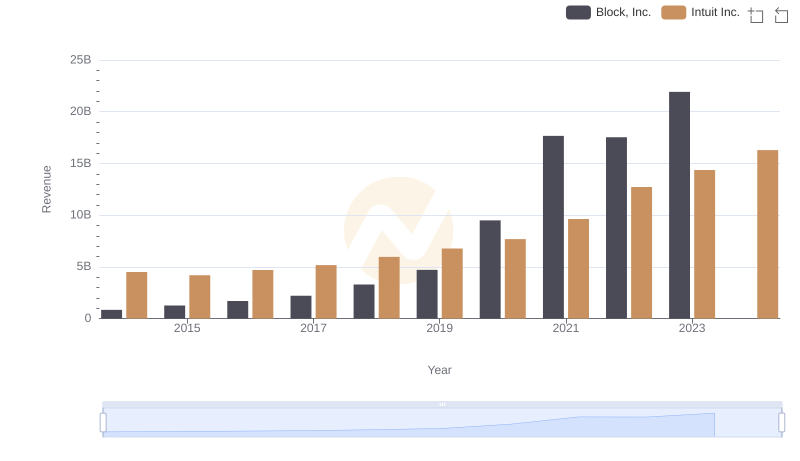
Breaking Down Revenue Trends: Intuit Inc. vs Block, Inc.
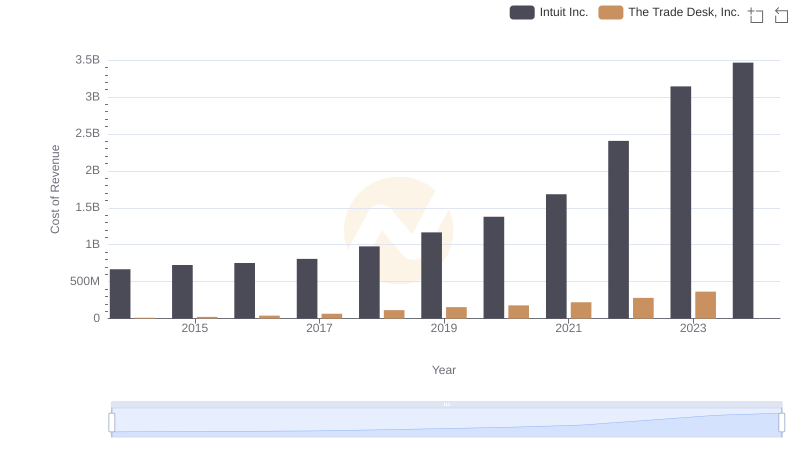
Intuit Inc. vs The Trade Desk, Inc.: Efficiency in Cost of Revenue Explored
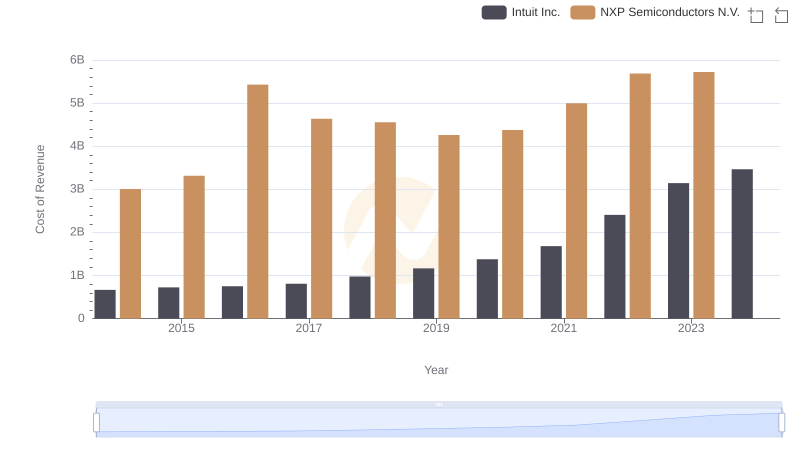
Comparing Cost of Revenue Efficiency: Intuit Inc. vs NXP Semiconductors N.V.
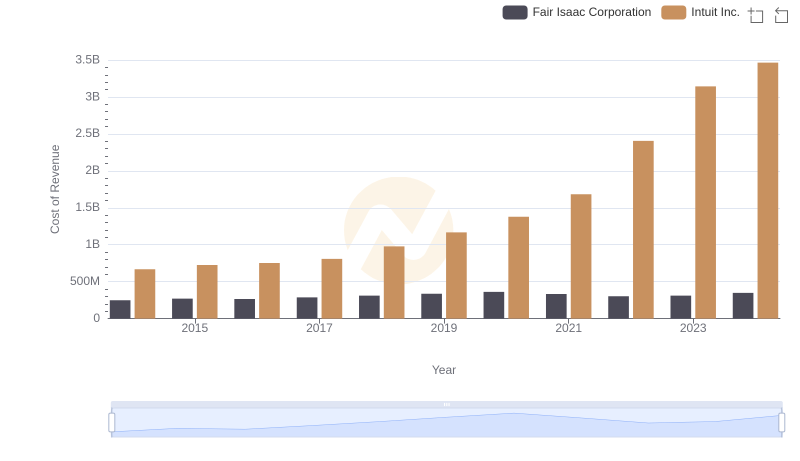
Cost of Revenue Comparison: Intuit Inc. vs Fair Isaac Corporation
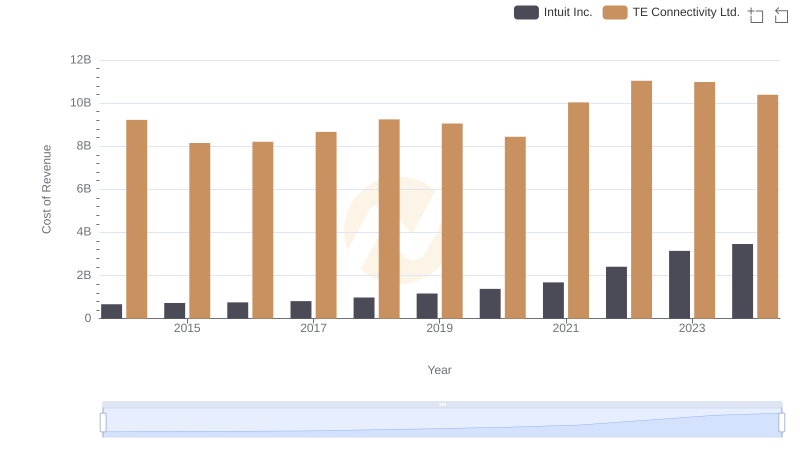
Cost of Revenue: Key Insights for Intuit Inc. and TE Connectivity Ltd.
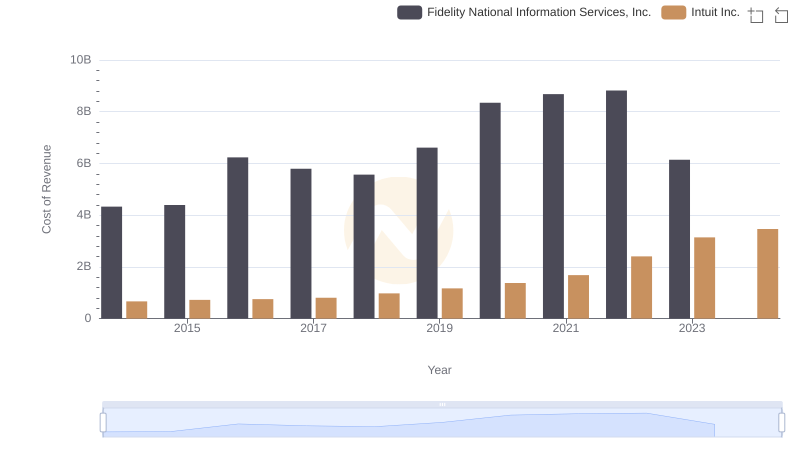
Intuit Inc. vs Fidelity National Information Services, Inc.: Efficiency in Cost of Revenue Explored
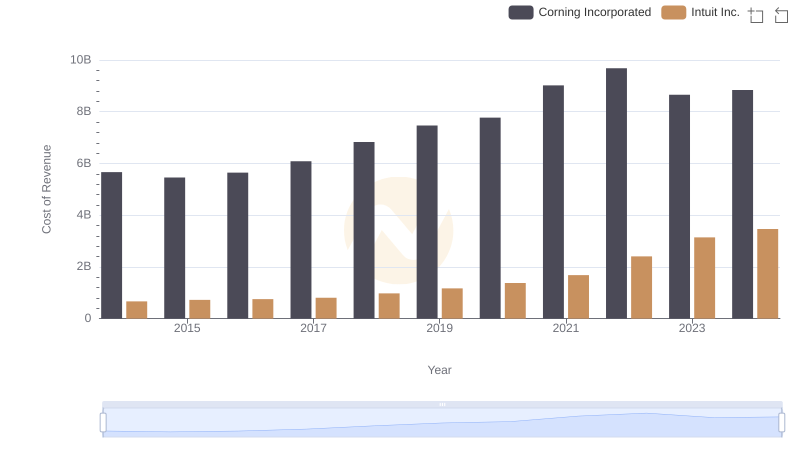
Cost of Revenue Trends: Intuit Inc. vs Corning Incorporated
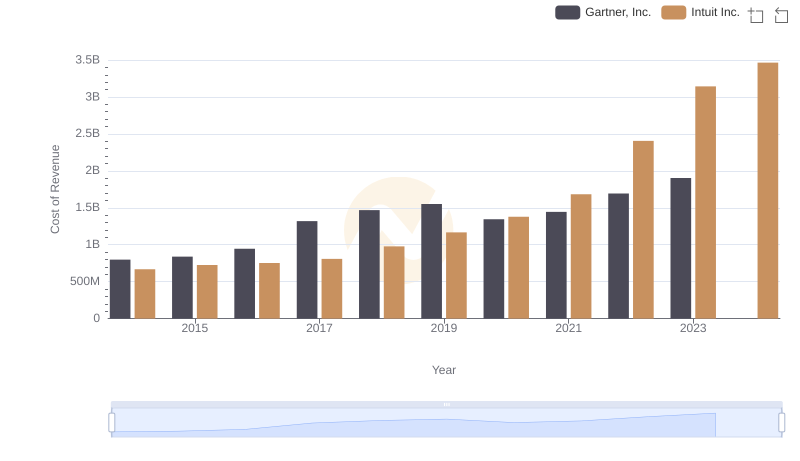
Intuit Inc. vs Gartner, Inc.: Efficiency in Cost of Revenue Explored
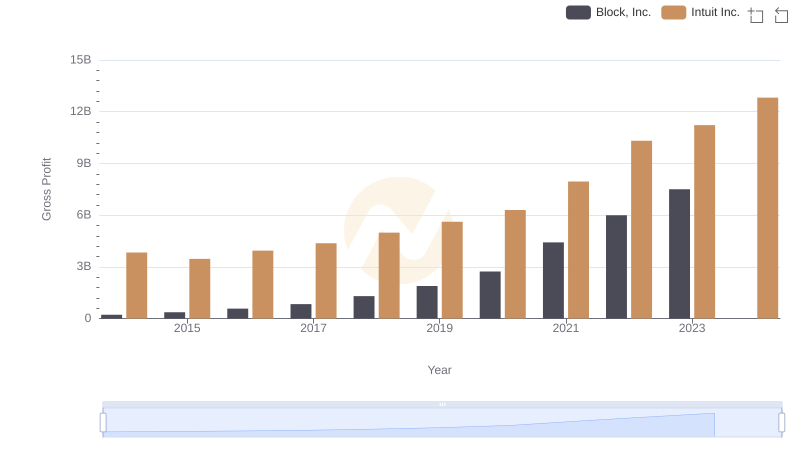
Gross Profit Comparison: Intuit Inc. and Block, Inc. Trends
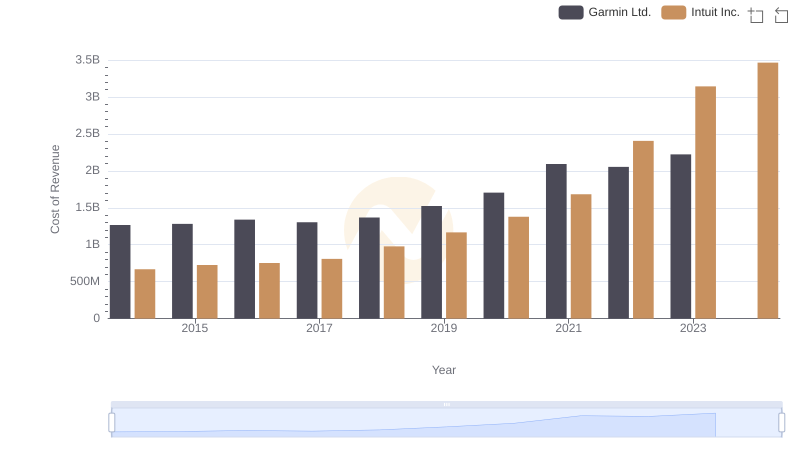
Cost of Revenue Comparison: Intuit Inc. vs Garmin Ltd.
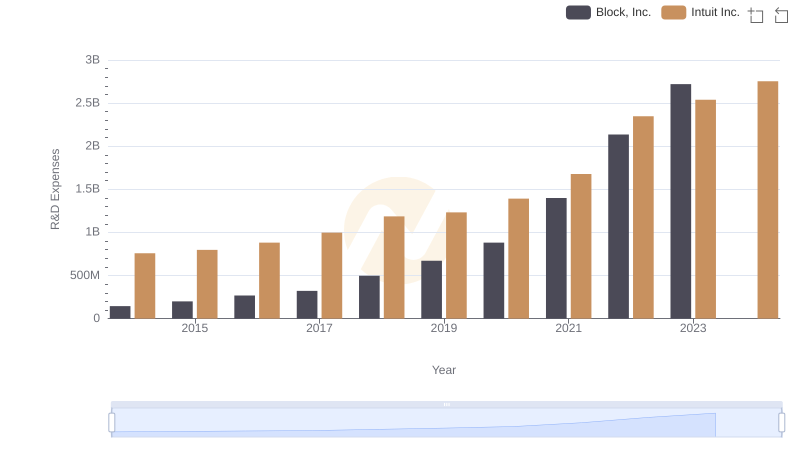
Comparing Innovation Spending: Intuit Inc. and Block, Inc.
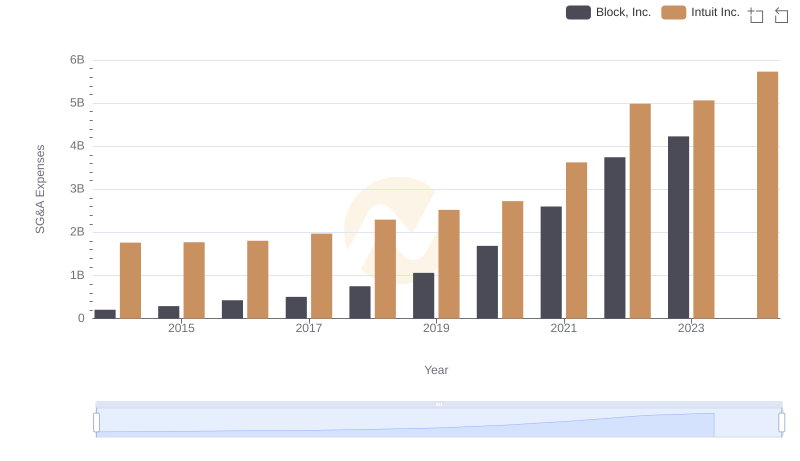
Intuit Inc. vs Block, Inc.: SG&A Expense Trends