| __timestamp | Fidelity National Information Services, Inc. | Intuit Inc. |
|---|---|---|
| Wednesday, January 1, 2014 | 4332700000 | 668000000 |
| Thursday, January 1, 2015 | 4393200000 | 725000000 |
| Friday, January 1, 2016 | 6233000000 | 752000000 |
| Sunday, January 1, 2017 | 5794000000 | 809000000 |
| Monday, January 1, 2018 | 5569000000 | 977000000 |
| Tuesday, January 1, 2019 | 6610000000 | 1167000000 |
| Wednesday, January 1, 2020 | 8348000000 | 1378000000 |
| Friday, January 1, 2021 | 8682000000 | 1683000000 |
| Saturday, January 1, 2022 | 8820000000 | 2406000000 |
| Sunday, January 1, 2023 | 6145000000 | 3143000000 |
| Monday, January 1, 2024 | 6323000000 | 3465000000 |
Data in motion
In the ever-evolving landscape of financial technology, understanding cost efficiency is crucial. Over the past decade, Intuit Inc. and Fidelity National Information Services, Inc. have demonstrated contrasting trends in their cost of revenue. From 2014 to 2023, Fidelity's cost of revenue peaked in 2022, reaching nearly 9 billion, before dropping by 30% in 2023. Meanwhile, Intuit's cost of revenue has shown a steady upward trajectory, increasing by over 370% from 2014 to 2023. This divergence highlights Intuit's aggressive growth strategy, while Fidelity's recent dip suggests a potential shift in operational focus. As we look to 2024, with data still emerging, these trends offer a fascinating glimpse into the strategic priorities of two industry giants. Understanding these dynamics is essential for investors and stakeholders aiming to navigate the fintech sector's complexities.
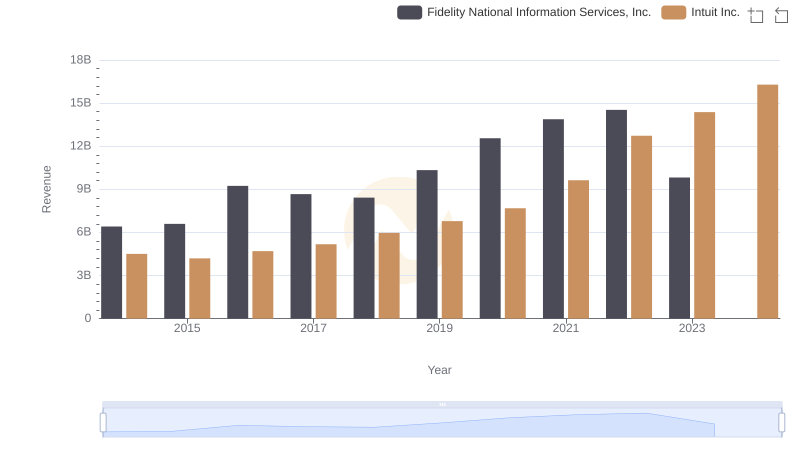
Revenue Insights: Intuit Inc. and Fidelity National Information Services, Inc. Performance Compared
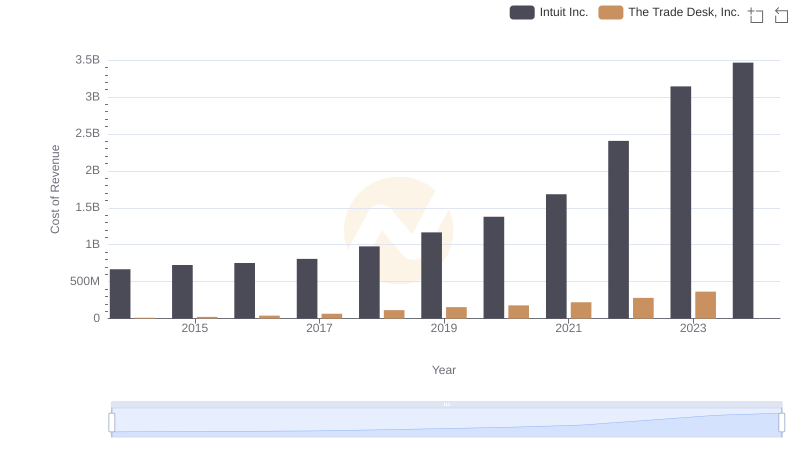
Intuit Inc. vs The Trade Desk, Inc.: Efficiency in Cost of Revenue Explored
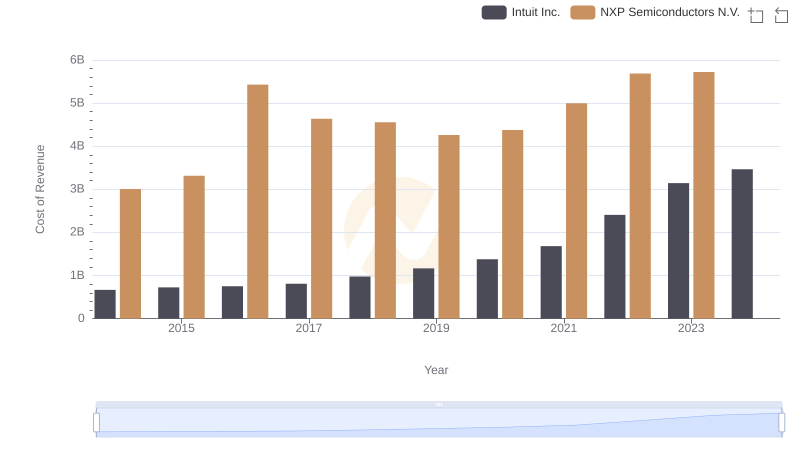
Comparing Cost of Revenue Efficiency: Intuit Inc. vs NXP Semiconductors N.V.
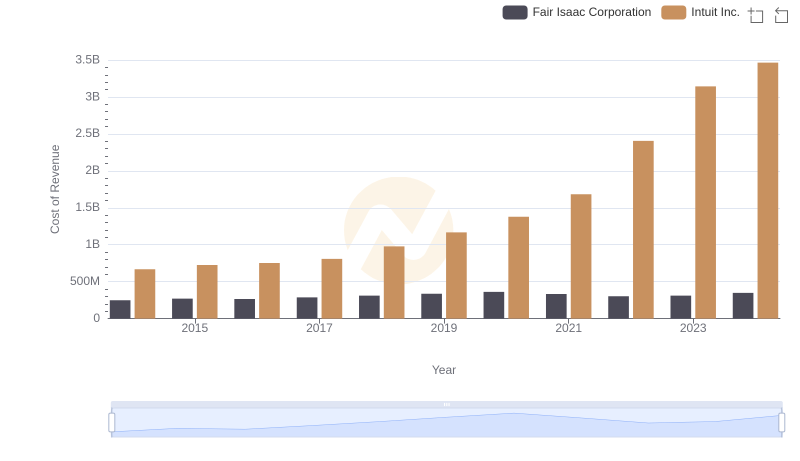
Cost of Revenue Comparison: Intuit Inc. vs Fair Isaac Corporation
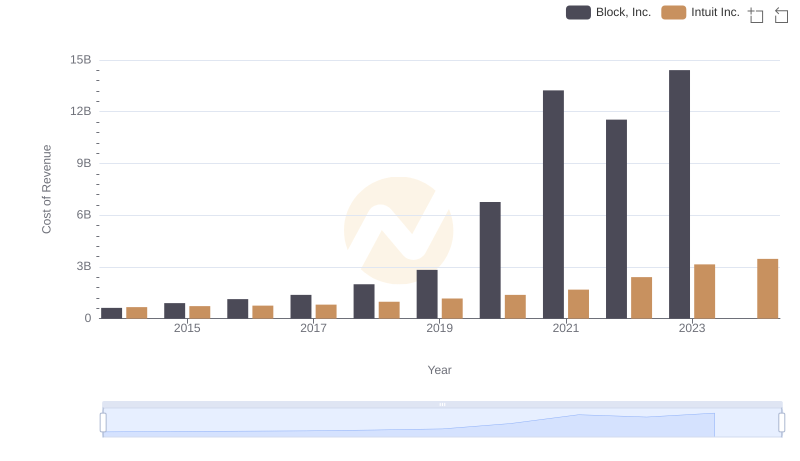
Cost Insights: Breaking Down Intuit Inc. and Block, Inc.'s Expenses
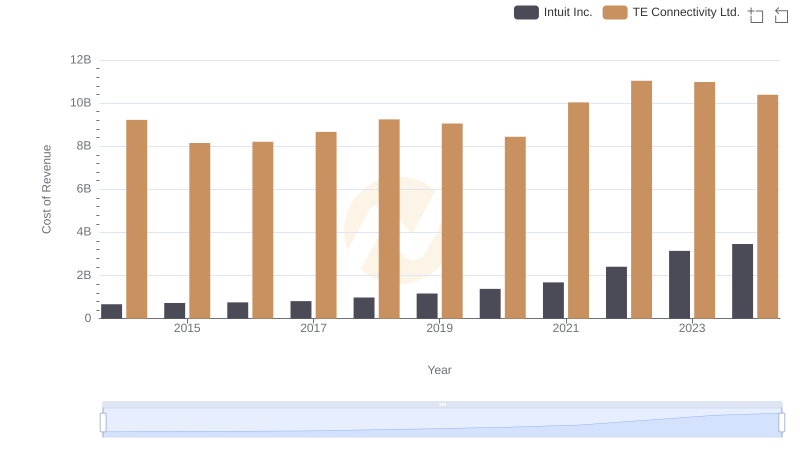
Cost of Revenue: Key Insights for Intuit Inc. and TE Connectivity Ltd.
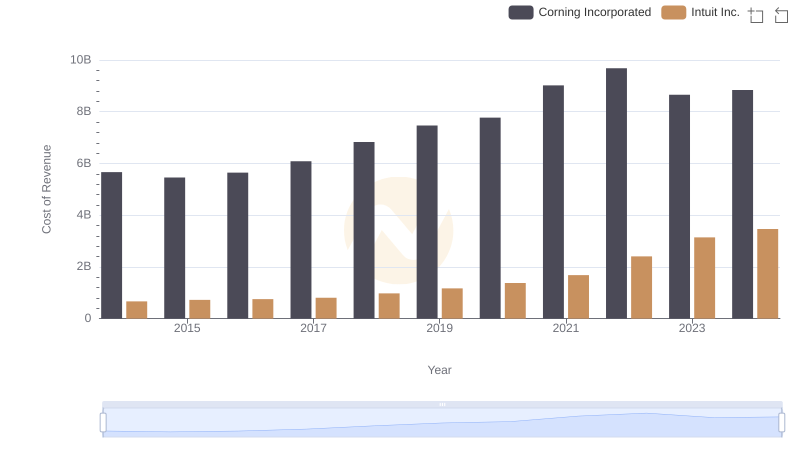
Cost of Revenue Trends: Intuit Inc. vs Corning Incorporated
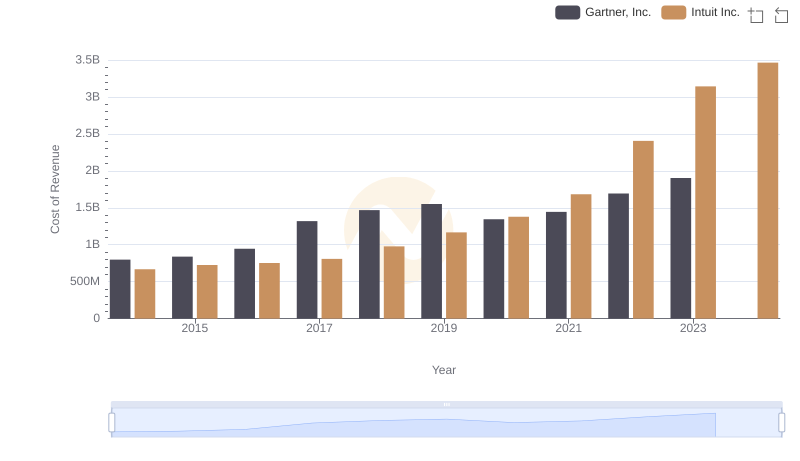
Intuit Inc. vs Gartner, Inc.: Efficiency in Cost of Revenue Explored
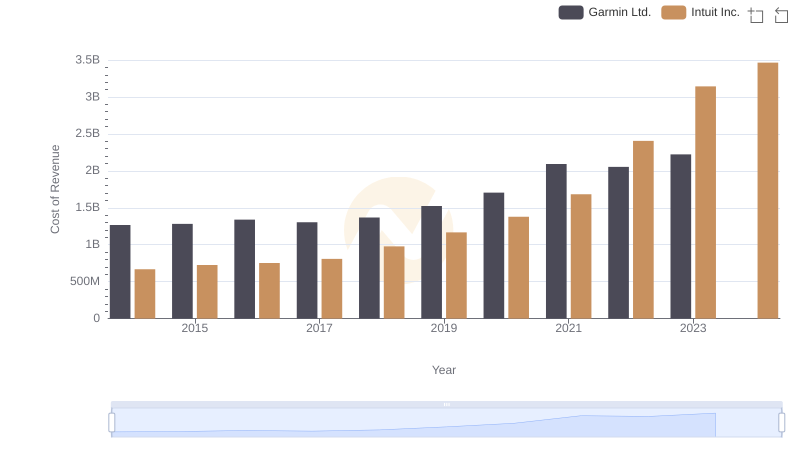
Cost of Revenue Comparison: Intuit Inc. vs Garmin Ltd.
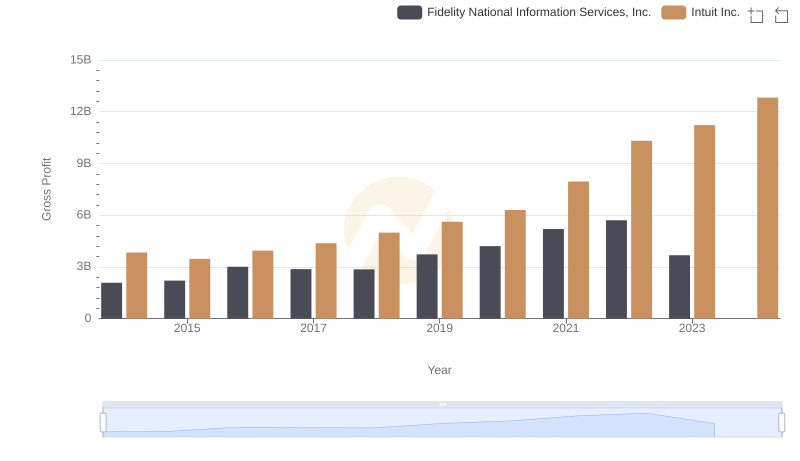
Gross Profit Analysis: Comparing Intuit Inc. and Fidelity National Information Services, Inc.
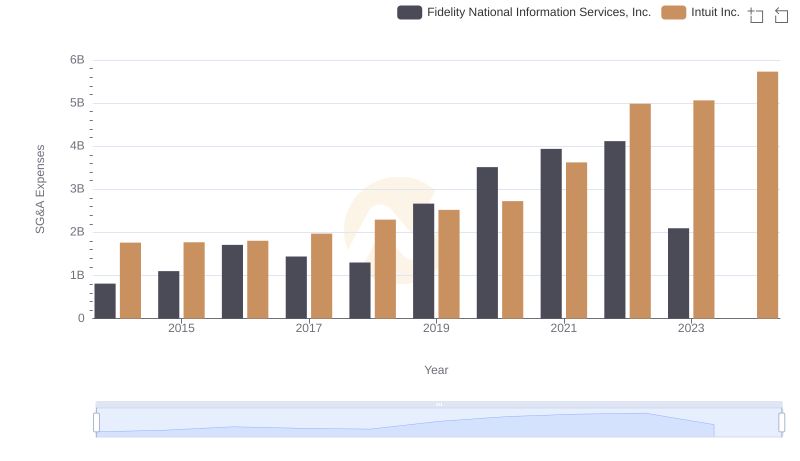
Comparing SG&A Expenses: Intuit Inc. vs Fidelity National Information Services, Inc. Trends and Insights
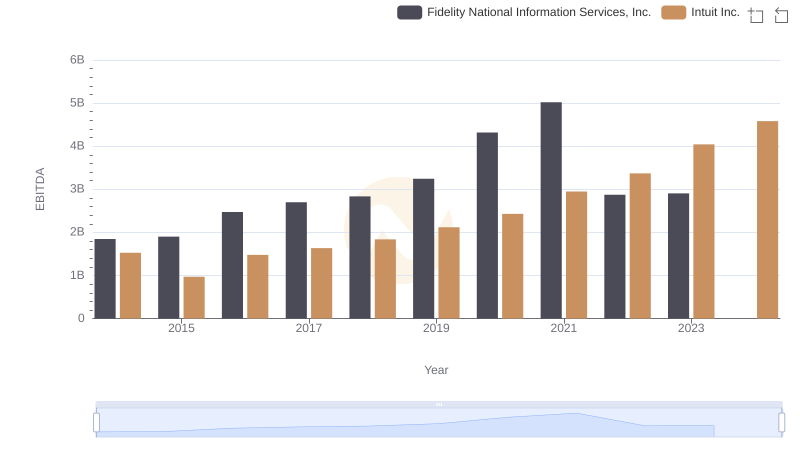
Comparative EBITDA Analysis: Intuit Inc. vs Fidelity National Information Services, Inc.