| __timestamp | Intuit Inc. | The Trade Desk, Inc. |
|---|---|---|
| Wednesday, January 1, 2014 | 1528000000 | 580000 |
| Thursday, January 1, 2015 | 970000000 | 32824000 |
| Friday, January 1, 2016 | 1480000000 | 61316000 |
| Sunday, January 1, 2017 | 1634000000 | 76565000 |
| Monday, January 1, 2018 | 1839000000 | 107323000 |
| Tuesday, January 1, 2019 | 2121000000 | 112196000 |
| Wednesday, January 1, 2020 | 2430000000 | 144208000 |
| Friday, January 1, 2021 | 2948000000 | 124817000 |
| Saturday, January 1, 2022 | 3369000000 | 168079000 |
| Sunday, January 1, 2023 | 4043000000 | 280898000 |
| Monday, January 1, 2024 | 4581000000 | 427167000 |
Unlocking the unknown
In the ever-evolving landscape of financial technology and digital advertising, Intuit Inc. and The Trade Desk, Inc. stand as titans of their respective industries. Over the past decade, Intuit has demonstrated a robust growth trajectory, with its EBITDA increasing by approximately 200% from 2014 to 2023. This growth underscores Intuit's strategic prowess in the financial software sector.
Conversely, The Trade Desk, Inc., a leader in programmatic advertising, has shown a remarkable rise in its EBITDA, growing nearly 400% over the same period. Despite starting from a smaller base, The Trade Desk's growth highlights the burgeoning demand for digital advertising solutions.
While Intuit's EBITDA reached a peak of $4.043 billion in 2023, The Trade Desk's figures for 2024 remain undisclosed, leaving room for speculation on its future performance. This comparison offers a fascinating glimpse into the financial health and strategic direction of these industry leaders.
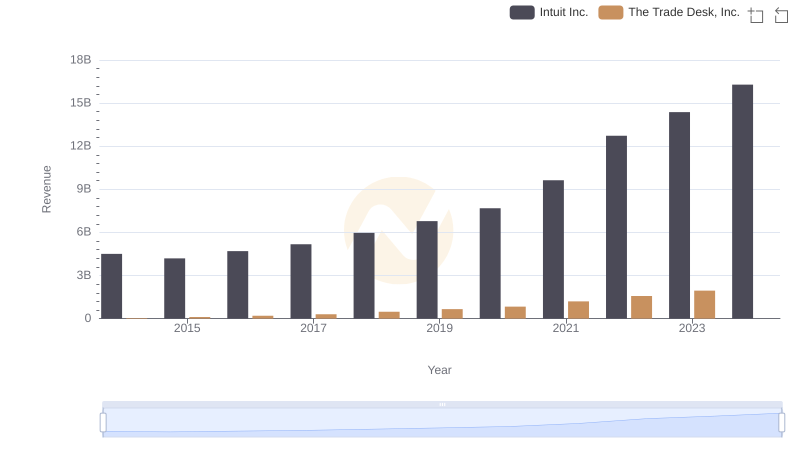
Revenue Insights: Intuit Inc. and The Trade Desk, Inc. Performance Compared
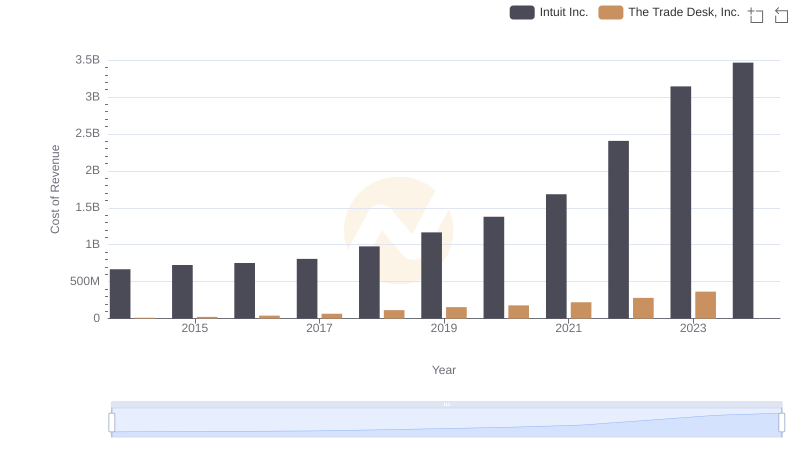
Intuit Inc. vs The Trade Desk, Inc.: Efficiency in Cost of Revenue Explored
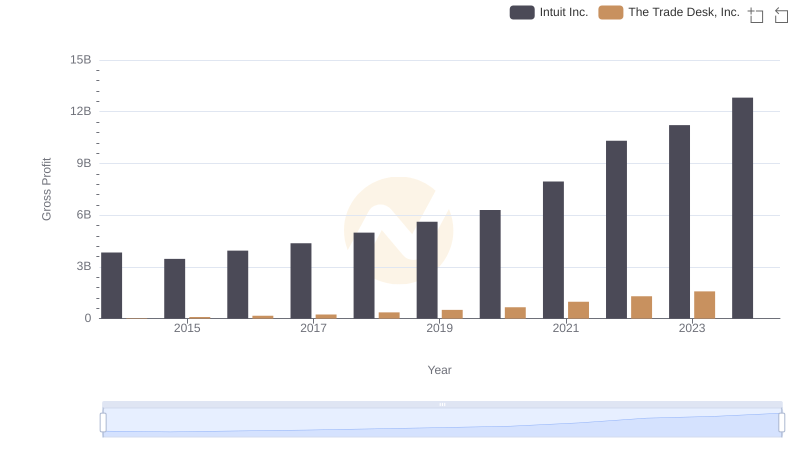
Gross Profit Comparison: Intuit Inc. and The Trade Desk, Inc. Trends
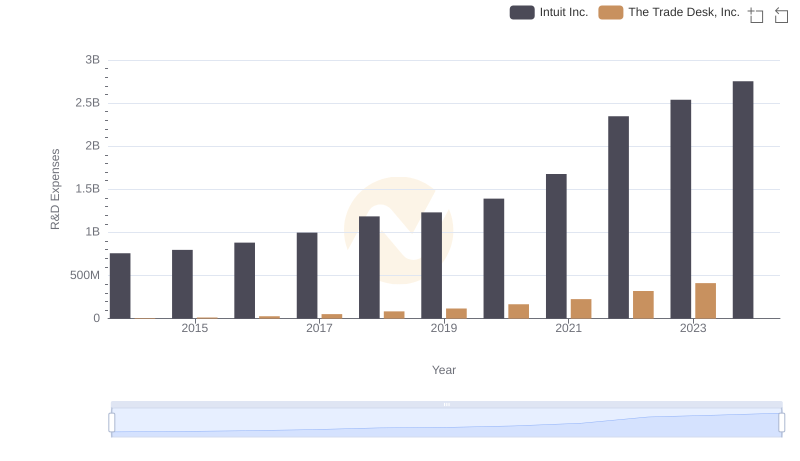
Research and Development Expenses Breakdown: Intuit Inc. vs The Trade Desk, Inc.
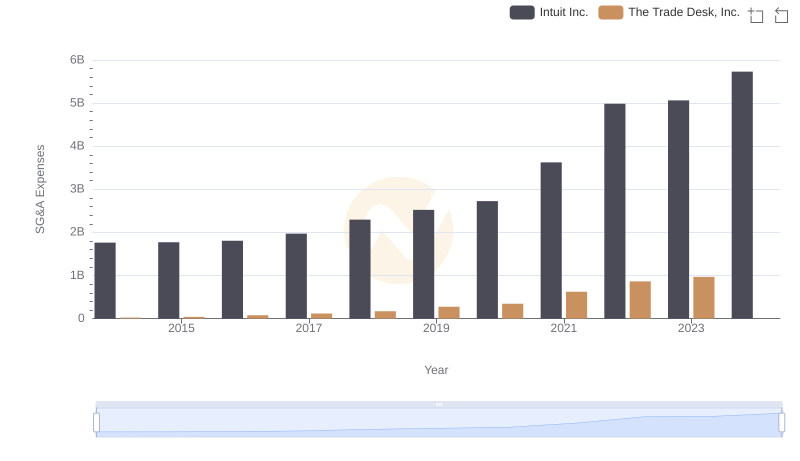
Intuit Inc. vs The Trade Desk, Inc.: SG&A Expense Trends
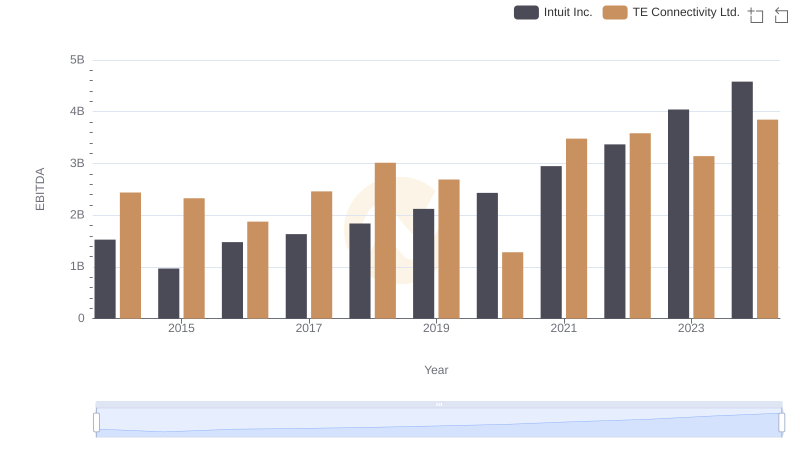
Intuit Inc. vs TE Connectivity Ltd.: In-Depth EBITDA Performance Comparison
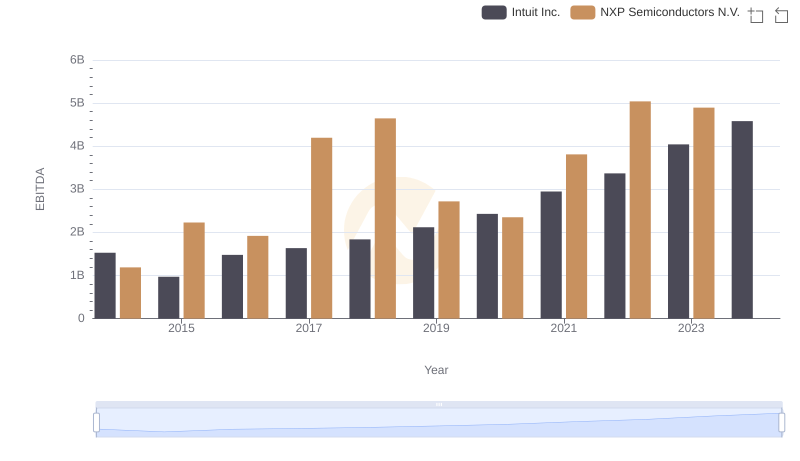
Professional EBITDA Benchmarking: Intuit Inc. vs NXP Semiconductors N.V.
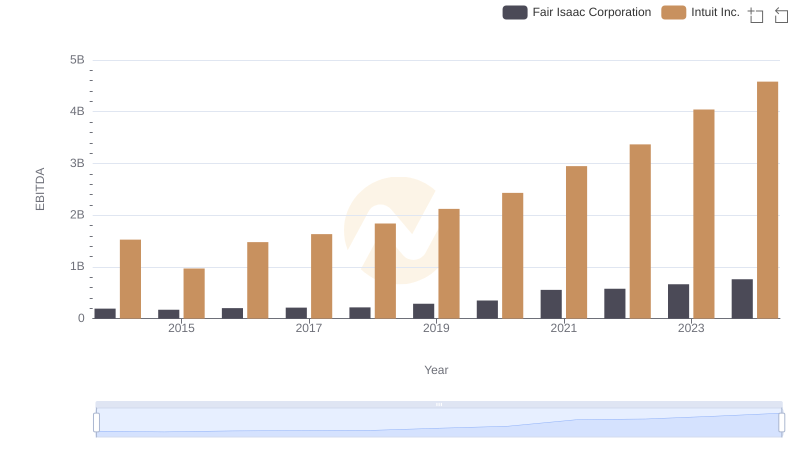
EBITDA Analysis: Evaluating Intuit Inc. Against Fair Isaac Corporation
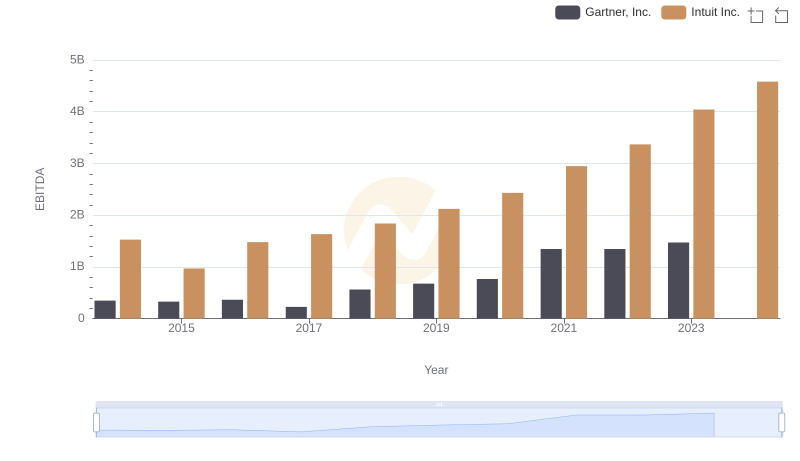
A Professional Review of EBITDA: Intuit Inc. Compared to Gartner, Inc.
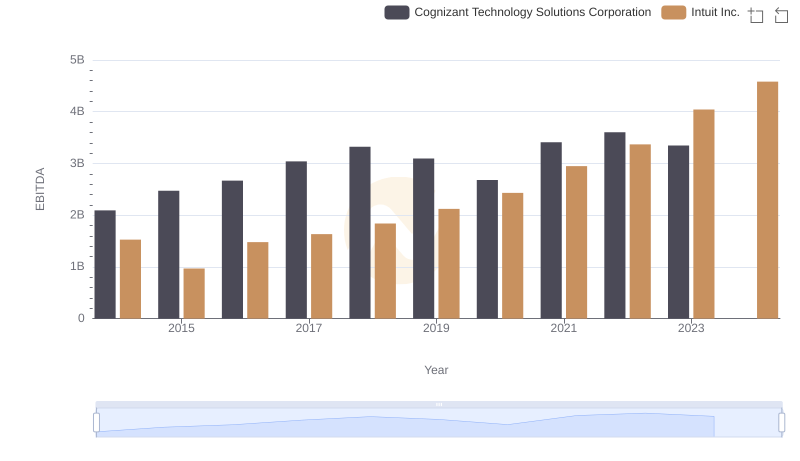
Comparative EBITDA Analysis: Intuit Inc. vs Cognizant Technology Solutions Corporation
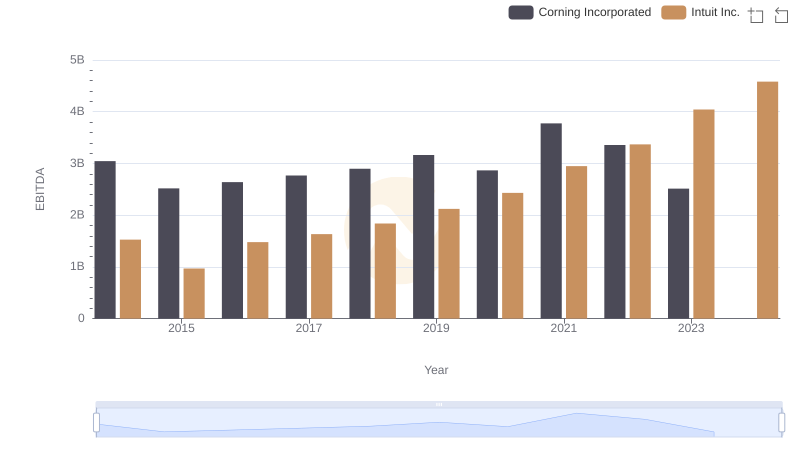
EBITDA Metrics Evaluated: Intuit Inc. vs Corning Incorporated
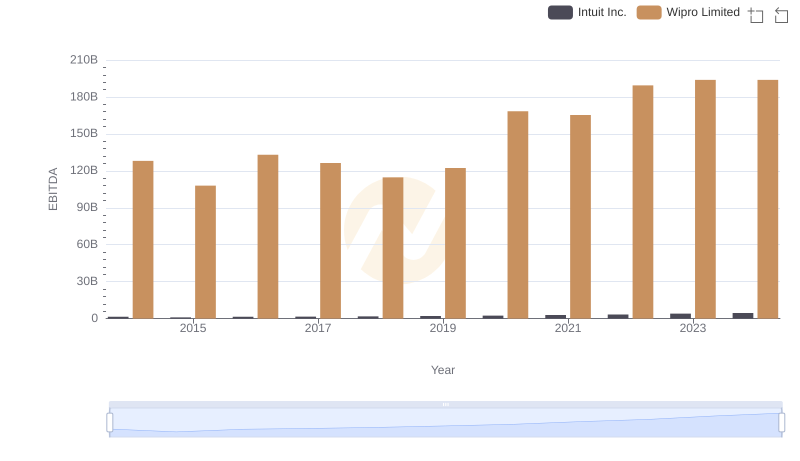
A Professional Review of EBITDA: Intuit Inc. Compared to Wipro Limited